
This content originally appeared on Level Up Coding - Medium and was authored by Javier Galindo

The Data Team Assembles! (One more time!)
The BI team gathered in the Barcelona conference room. Nancy arrived fifteen minutes earlier to setup for the meeting. She plugged her laptop to the projector and printed some copies of the slide show.
Serena: “Wow, I love how you prepared for this.”
Nancy: “Thank you. I figured it would be better to put something nice together. We have a lot to cover and discuss.”
Jonathan entered the room in good spirits. He carried a tray with coffee he bought for the team.
Nancy: “Oh thanks for the coffee!”
Serena: “Shall we get started?”
You can access the Miro board using this link.
Nancy: “Thank you for being here today. The purpose of this meeting is to conduct a thorough review of the data at our disposal, examine the tools we are currently using, and discuss the design of the data pipeline we intend to develop for the Underwriting team.”
Serena and Jonathan both nodded at the same time.
Nancy: “Let’s begin by reviewing the business requirements.”
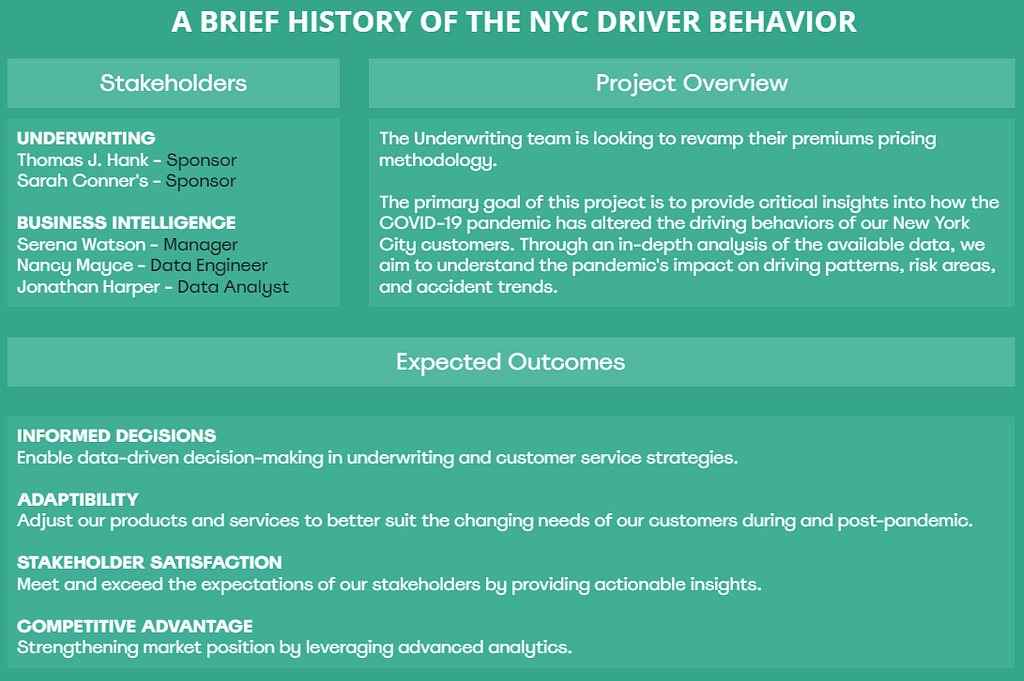
Jonathan: “From our conversation with the Underwriting team it sounded like their analysts did not account for COVID in their projections.”
Serena: “To be fair nobody did. This is happening all across the industry.”
Nancy: “Correct. During our last team meeting we reviewed our approach and methodology.”
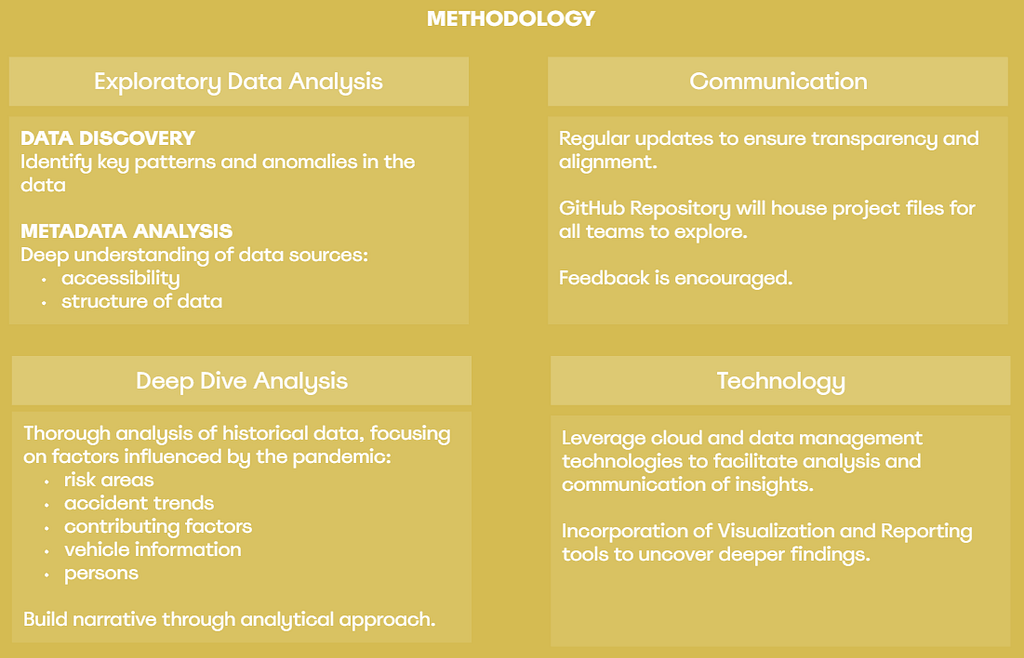
Jonathan: “Yes, and we did the exploratory analysis just a few days ago.”
Nancy: “We performed a thorough analysis of the metadata from NYPD Open Data API datasets. We reviewed the crashes, vehicles and person tables in detail.”
Jonathan: “We reviewed the schema structure, the relationships between tables and the different characteristics of the data.”
Serena: “What did you discover?”
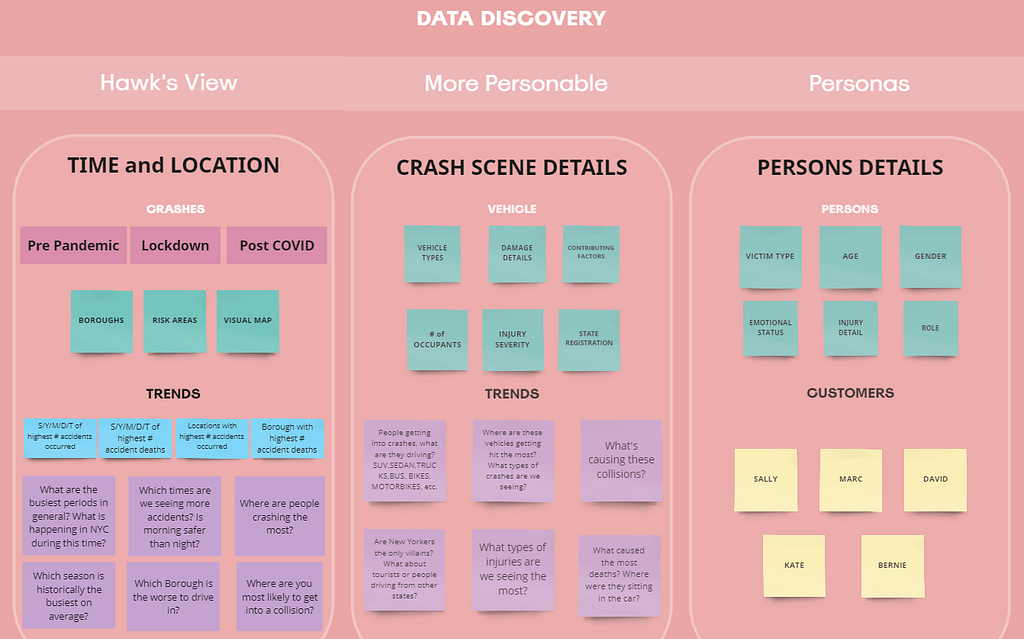
Nancy: “Crashes is the parent table. It can have multiple associated records in both the vehicles and person tables. Each vehicle and person record is tied to a specific collision through the COLLISION_ID foreign key.
Also, vehicles acts as a parent to the person table. Each person record is tied to a vehicle using the VEHICLE_ID foreign key, indicating that a person (such as a driver or passenger) is part of a specific vehicle involved in a collision.
Serena: “What other characteristics of this data can you point out?”
Nancy: “Sure. This dataset includes both temporal and spatial information, capturing the date and time of accidents alongside geographic details like latitude and longitude, which will help us map trends later on.
We’ve noted various contributing factors to collisions, which can give us clues about common causes once we dig deeper. We also have metrics on the severity of incidents, tracking injuries and fatalities. The vehicle information covers type and damage, and we collect personal details about victims, including age and actions leading up to the crash.”
Serena: “Interesting. How do you plan to carry on the analysis?”
Nancy: “Jonathan, do you mind?”
Jonathan: “Sure! To carry on the analysis, we’ll begin by establishing a broad overview of the collision data, which we’re calling the Hawk’s View. This approach will allow us to set the context by examining historical trends in NYC driving patterns, particularly before COVID-19. We’ll analyze key statistics to identify peak accident periods and seasonal variations, helping us understand when and why these incidents occur. By layering in location data, we can pinpoint areas with the highest accident rates and any changes during significant periods, such as the pandemic lockdown.
As we delve deeper, we’ll focus on the details of the accidents themselves, asking specific questions about the types of vehicles involved, the nature of the collisions, and potential causes. This detailed examination will help us develop personas that represent different types of drivers in NYC, making the data more relatable and engaging for our audience. By connecting these insights to real-life scenarios, we aim to create a compelling narrative that not only highlights the statistics but also resonates with the experiences of those on the road.”
Serena: “Sounds like a solid strategy. What about the technical side? Have you decided on a design for the solution?”
Designing the Data Pipeline
Nancy took out a small laser pen from her right front pocket. She pointed the neon green laser dot to the 55inch projector screen.
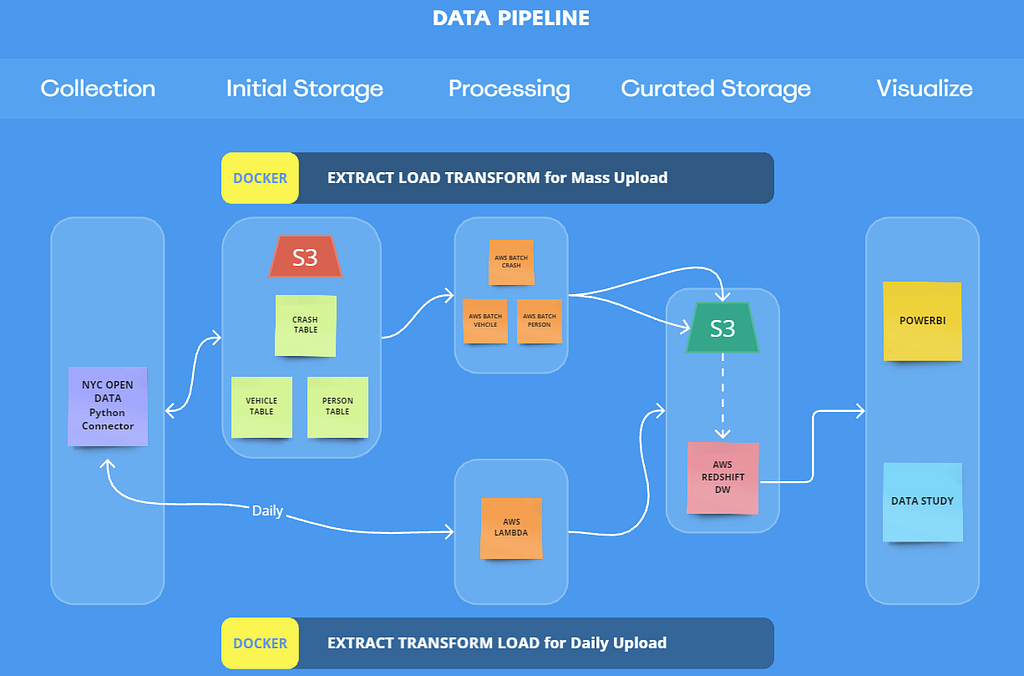
Nancy: “I came up with the following ecosystem using the AWS Cloud Services. This data pipeline is designed to transform raw data into actionable insights. This will enable us to process large amounts of data efficiently and reliably.”
Serena: “How much data are we talking about?”
Nancy: “The crashes table has 2.09M rows and 29 columns. The vehicles table has twice as many rows 4.19M and 25 columns. Finally, the person table has 5.37M rows and 21 columns.”
Serena: “Can you explain this diagram? What’s going on here?”
Nancy: “Yes, no problem. I thought it was best to build data pipelines for two scenarios: Mass Data Upload and Daily Updates Upload.”
1. MASS DATA UPLOAD PIPELINE
I started by dividing the Mass Data Upload pipeline into multiple stages: Collection, Initial Storage, Processing, Curated Storage. This was done initially to setup the AWS cloud environment.
Collection and Initial Storage:
The goal in this stage is to securely retrieve data from the NYC OpenData API endpoints and store it inside an AWS S3 bucket dedicated to raw collisions data.
I developed two Python applications that run on a local machine. We can also set up Lambda functions and AWS ECR to run these scripts on the AWS cloud using a manual trigger.
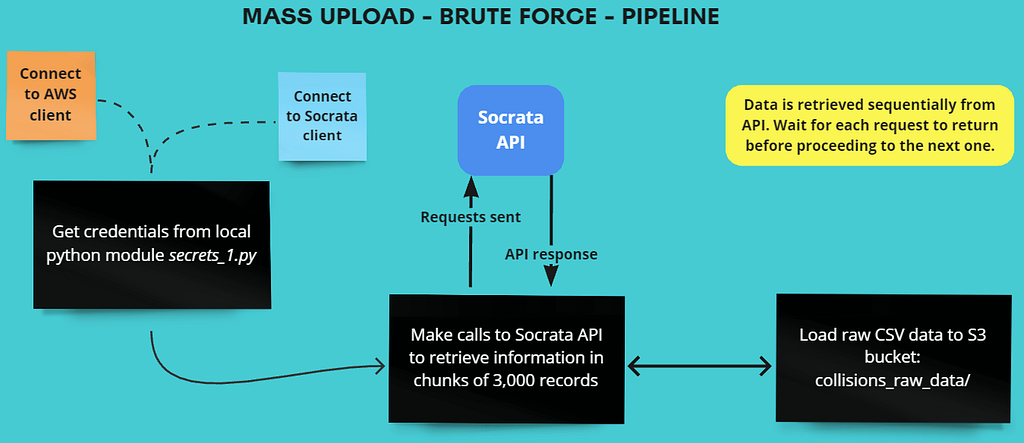
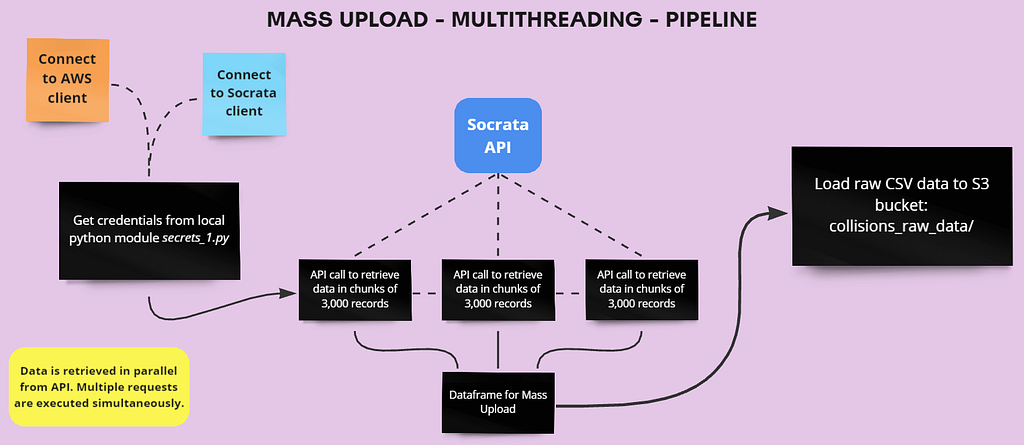
The API has individual endpoints for each one of the tables in the dataset: collisions, vehicles, and persons. Once retrieved, this data is securely stored within the S3 bucket called nyc-application-collisions/collisions_raw_data/.
Methods of collection
I devised two distinct methods for the data collection process: sequential retrieval and parallel retrieval. Each method has its own set of advantages and drawbacks, extensively discussed in the project’s GitHub repo.
Approach #1: Sequential Retrieval
Approach #2: Parallel Retrieval
Data Processing and Curated Storage
I am running several batch jobs to execute a Python application that extracts data from the raw collisions data bucket in S3. This process involves transforming the raw data into a format suitable for in-depth analysis.
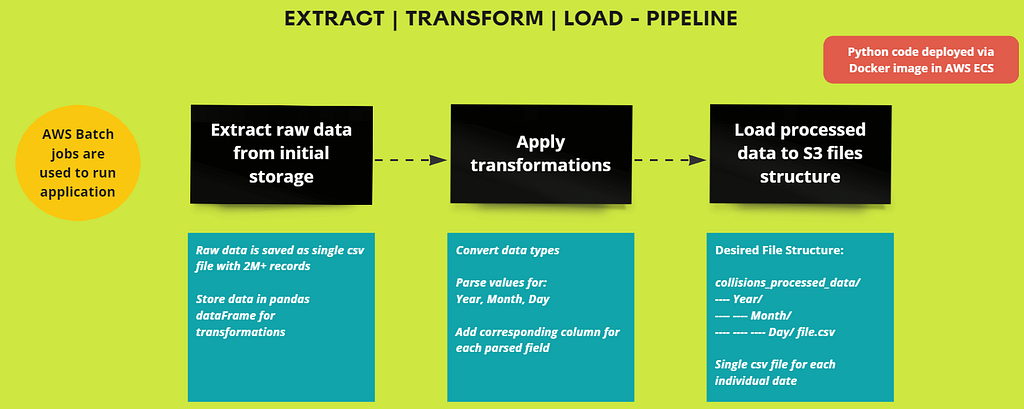
This code is deployed in the cloud using a Docker image, which is managed and executed through AWS ECR. The data is then stored in the processed collisions data bucket in S3.
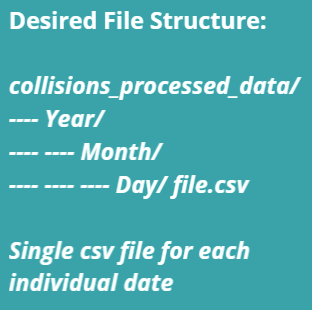
The processed data is stored as a csv file for a particular date. This is the file structure in the processed collision data bucket in S3:
The data is now ready to be consumed.
2. DAILY UPDATES DATA PIPELINE
Compared to the Mass Data Upload, this pipeline is more comprehensive as it incorporates a complete Extract, Transform, Load (ETL) process to prepare the data for consumption.
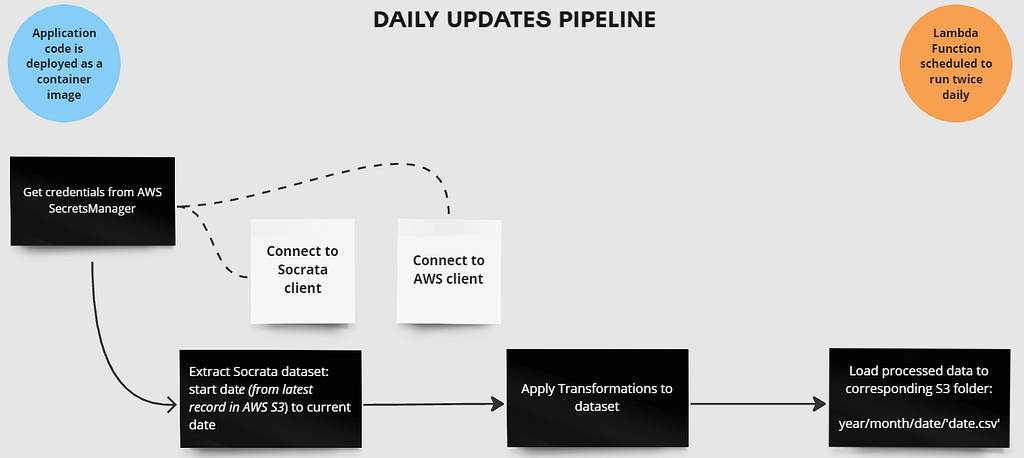
We will handle the retrieval and processing of data according to a pre-defined daily schedule, ensuring our dataset remains current and actionable. This pipeline will skip the Initial Storage phase as it’s designed to extract fewer records than the Mass Data Upload pipeline.
Like in the Data Processing pipeline, I deployed a Python application on the cloud using a Docker image, which is managed through AWS ECR. The image is then executed via AWS Lambda, and it’s scheduled to run twice daily.
Full tutorial and code here.
3. DATA WAREHOUSING FOR ANALYSIS
I selected AWS Redshift as our Data Warehouse solution because it efficiently handles large datasets and supports complex queries, making it ideal for Online Analytical Processing. I plan to meet with the Underwriting analysts soon to ensure they’re comfortable using the platform and can effectively leverage its capabilities to address their business questions. My objective is to confirm that it aligns with their requirements and supports their data analysis needs.
4. DATA VISUALIZATION AND REPORTING
We’ve selected Power BI and Miro as our primary tools. Miro will serve as our main storytelling platform, while we’ll leverage Power BI to create comprehensive dashboards that enhance our narrative.
Additionally, we plan to develop a mapping application using Power BI’s geospatial features. This integration of tools will create a dynamic data pipeline, which is essential for analyzing the complexities of urban driving behavior in the post-pandemic landscape.
Serena: “That’s a well-thought-out design, Nancy. I really appreciate the level of detail, but I want to make sure we’re on the same page moving forward. How are we planning to track the progress and make sure any issues are caught early? And secondly, what’s our strategy for integrating these findings into actionable insights for the Underwriting team?”
Jonathan: “Actually, I was thinking we could use Miro to map out our personas study alongside the data pipeline. This way, we can visually connect the key personas with our insights from the collision data, making it easier for the Underwriting team to understand driver behaviors in a way that feels more intuitive and accessible. I’ll also use the board to track progress visually — marking milestones and any areas where we’re hitting blockers — so we can quickly identify where things might need attention.”
Nancy: “That makes sense. On top of that, I’ll set up regular checkpoints — say, bi-weekly — where we’ll review the status of the data pipeline, highlight any challenges, and resolve them early. I’ll also build out a dashboard in Power BI that monitors the data quality at each stage of the pipeline, so we can detect anomalies and address issues before they impact our final analysis.”
Serena: “That’s exactly what I was looking for. Thanks. And what about the Underwriting team?”
Nancy: “Once we get the pipeline stabilized, I’ll schedule a meeting with the Underwriting analysts later this week to walk them through the Redshift platform and ensure they’re comfortable with the data. We’ll review their pain points and confirm our approach is aligned with their needs. After that, we’ll refine the pipeline based on their feedback.”
Serena: “Perfect. I’m confident we’re heading in the right direction. Let’s keep communication tight and ensure we hit those checkpoints. Nancy, let me know how the meeting goes with the Underwriting team.”
Nancy: “Will do. I’ll keep you both updated once I have their input.”
Conclusion
A key factor in the success of this project is the strength and collaborative nature of the BI team. Open communication and trust in each member’s skills and intuition will drive them toward a successful outcome. The project leverages tools like Docker, Python, and AWS cloud services (Lambda, ECR, S3, and Redshift) to build a robust data pipeline capable of handling large-scale data efficiently, while maintaining both scalability and flexibility.
Data visualization platforms such as Power BI and Miro bring the data story to life, enabling stakeholders to gain valuable insights. By utilizing predictive analytics and real-time monitoring, the team will foresee potential challenges and address them proactively, ensuring that disruptions are minimized and progress continues smoothly.
Next Steps
In the next section, both the BI and Underwriting teams will join forces to review and assess the solutions developed by Jonathan and Nancy. The focus will be on analyzing the historical data gathered through the newly developed pipeline, ensuring the solutions effectively address past challenges and provide meaningful insights.
Thank you for spending a few minutes with me today — I’m grateful for your time and interest. For a deeper dive, visit my GitHub page to explore project resources.
Let’s connect!
You may find me on LinkedIn. You can also visit my personal site if you are interested in more content like this.
Please don’t forget to follow my Medium page to catch each update in the series.
Part 4c: Data Pipeline Design and Execution was originally published in Level Up Coding on Medium, where people are continuing the conversation by highlighting and responding to this story.
This content originally appeared on Level Up Coding - Medium and was authored by Javier Galindo
Javier Galindo | Sciencx (2024-10-24T01:05:53+00:00) Part 4c: Data Pipeline Design and Execution. Retrieved from https://www.scien.cx/2024/10/24/part-4c-data-pipeline-design-and-execution/
Please log in to upload a file.
There are no updates yet.
Click the Upload button above to add an update.