
This content originally appeared on HackerNoon and was authored by Vincent
\ \
Introduction
Art looks good, and as you all know, making art is a big flex 💪. I mean, look at Picasso. His drawings sell for a whole truckload of money. However, when I try to draw something, I'm so messy or uncoordinated that a 'sketch' of a person would end up so simple that I could graph it. So I thought, what if I graph a drawing instead? (I’m not going to draw a graph; there is a fine line between them). The Desmos graphing calculator seems like the perfect way to do it. It’s easily accessible, and we can easily make something good there.
Increasing brain waves
\ When you draw, you put your pencil on the paper and move your hand to another location. What if you do the same on a Desmos graph and hope that a line appears? Well, unfortunately, the graph only moves. Boring. Well, with a few extra steps, you can basically “add additional functionality” to Desmos to make it the drawing applications of your dreams ;) (and it’s a big flex, too).
Step 1: POINTS CAN MOVE???? AIN’T NO WAY
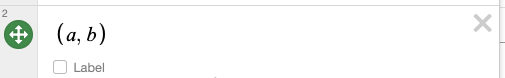
If a point is defined with x and y as variables, you can somehow move the point to define a new x and y. Crazy, right?
\
Step 2: Defy the laws of high school graphing by making a shape without using x or y
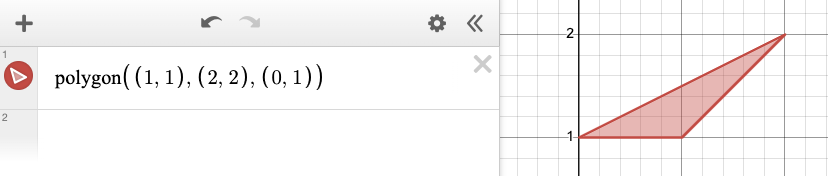 By putting in a list of points through the “polygon” function, Desmos automatically draws and fills in a shape for you. This built-in function is undoubtedly the most important function used in the entire graph, as it handles all the drawing aspects. All that is left to do is to get user input (coordinates) effectively and supply the points into the function.
Step 3: Custom Function
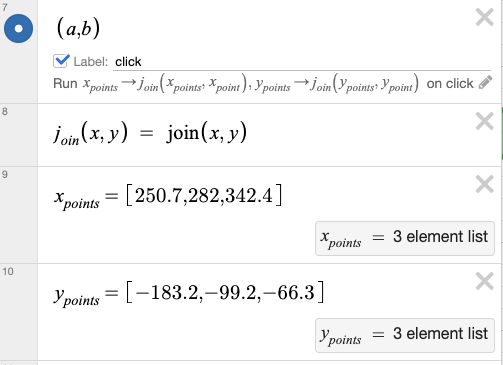
There's this feature in Desmos called actions that allow for on screen events to happen in response to a click, by activating it you can write cool features that feel more like code than math. Such as:
Actions require an account on the platform, so better create one now.
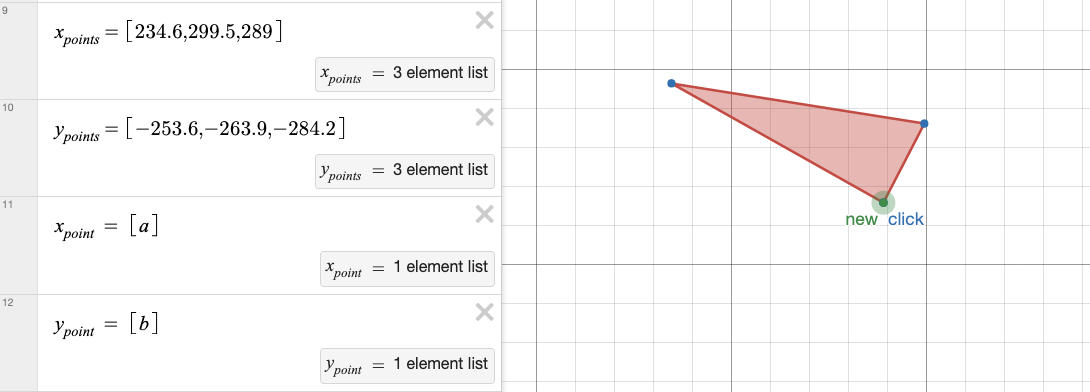
Step 4: Defining some lists
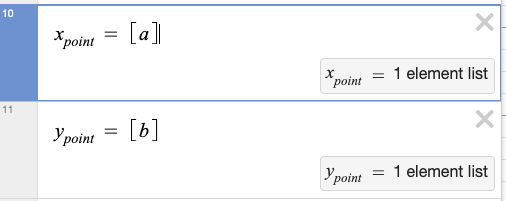
These two lists, shown by brackets [], are the x and y points where my point (a, b) is. When the point is moved by the user, the lists change. You might be wondering why the a and b are in []. This is important later.
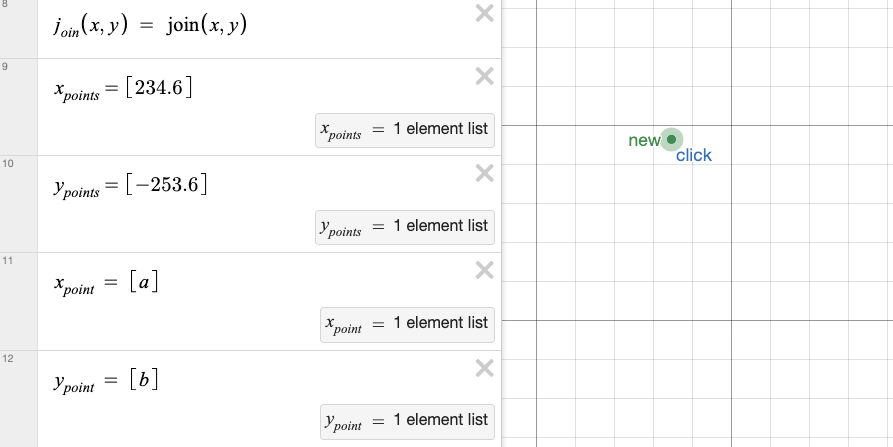
Step 5: More definitions
\ When I click on my tiny little point here, I'm gonna use the Desmos function join() to add the values of 2 lists. The x point defined from earlier is added to the x points list through this method. This is to create a list full of x values my little dot has moved to. Same with y. As the x and y point from earlier was defined in a list e.g. [a] it ensures that it adds the value properly to the x points list, otherwise the result is weird. Join() only joins lists, so I am adding two lists together.
\
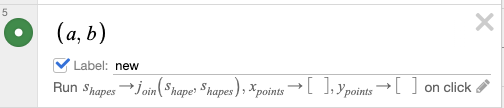
Here, once the label “click” is clicked, the x points list will add the number from the list containing the current x point. The data is stored and saved.
Step 6: It’s polygon time
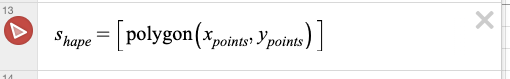
This defines x and y points as lists of multiple numbers that form a polygon. By putting in all the collected x values and y values a polygon is made. Here's what we have so far:
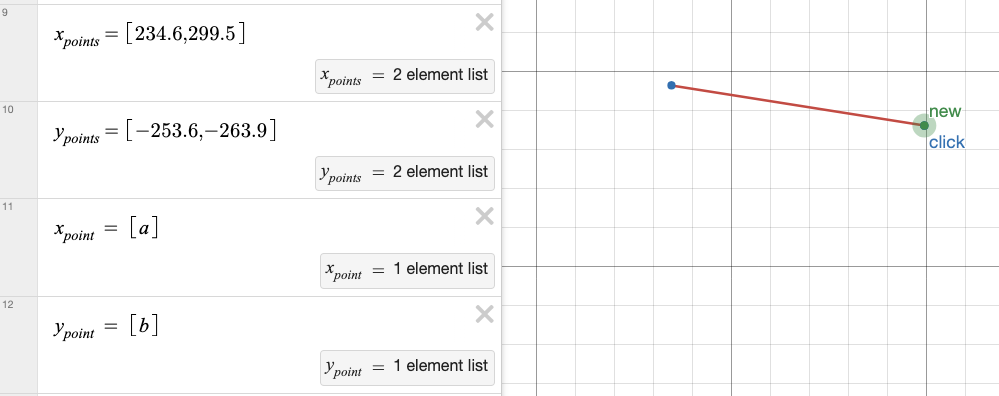
Repeat the process more times, and you can get an extremely weird-shaped polygon.
Step 7: OMG, WHY WON’T THIS SEPARATE
You might soon find out that if you continue this the whole thing is just one big funky shape and is a mess like my handwriting. Not good.
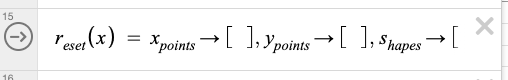
\ Introducing my “new shape” function! This bad boy, using similar concepts of joining lists, adds the newly created polygon (from 'shape' list) into another list 'shapes' (notice the plural). It also resets the x points and y points lists on the original shape so that you are free to define a new polygon while keeping the original intact. The original is saved in the “shapes” list. All you have to do is click “new” on the screen.
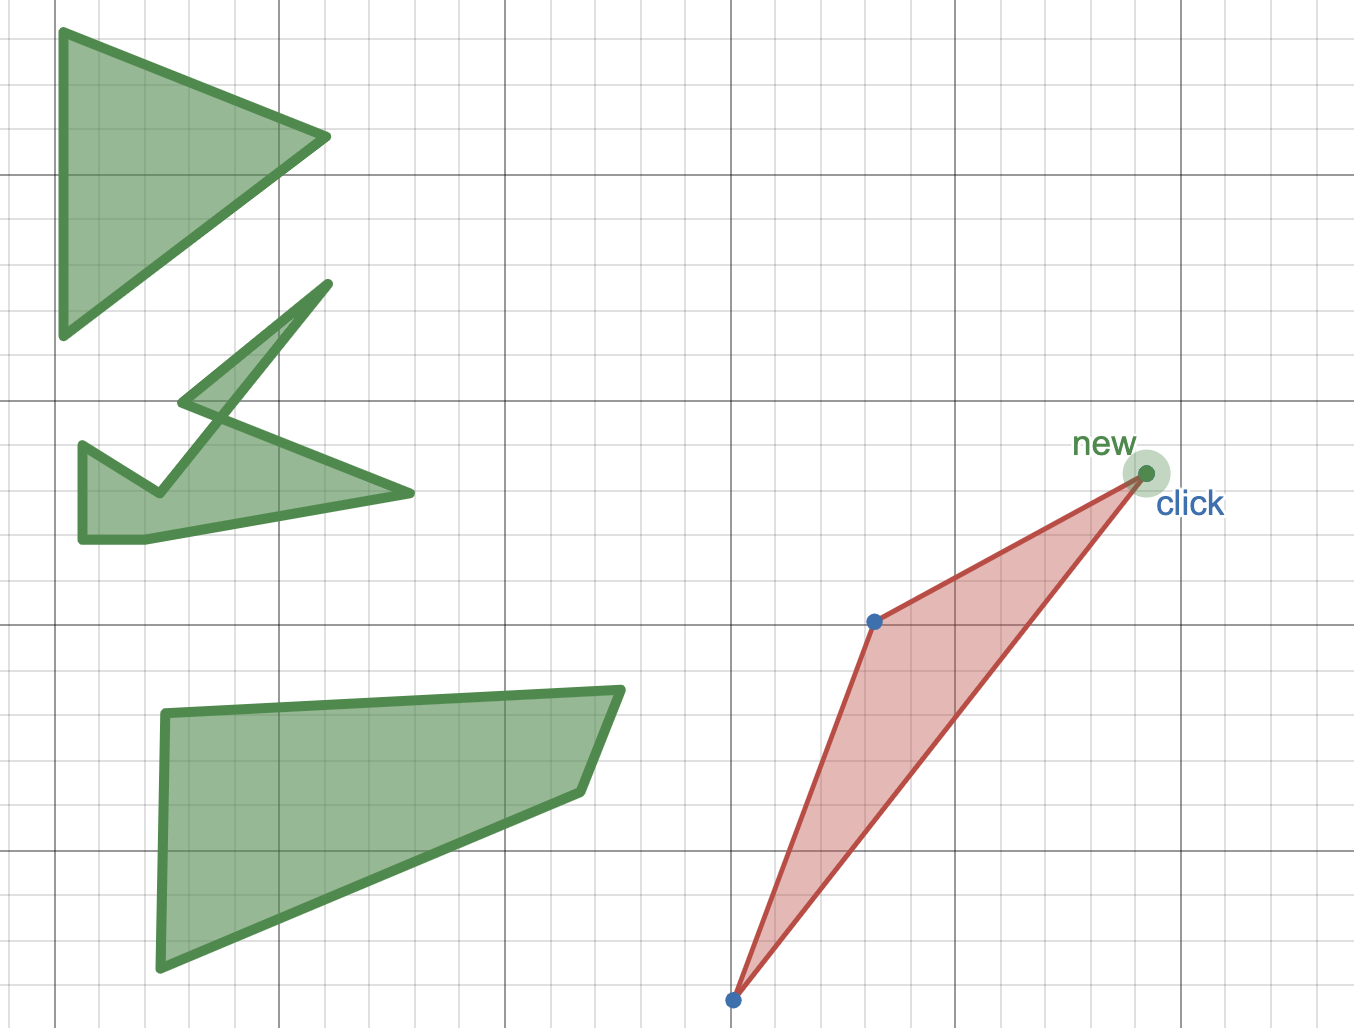
As you can see, you can now create all sorts of shapes with the function without fear of being all linked together in one shape.
Step 8: Draw em
By continually drawing a polygon, adding it to the list, and drawing another one, you can get something vaguely resembling a drawing. Oh, and the function from step 3- it undoes all the drawings, leaving you on a fresh cartesian plane to draw on 🙂↕️. You don't want to continually use the undo button :(
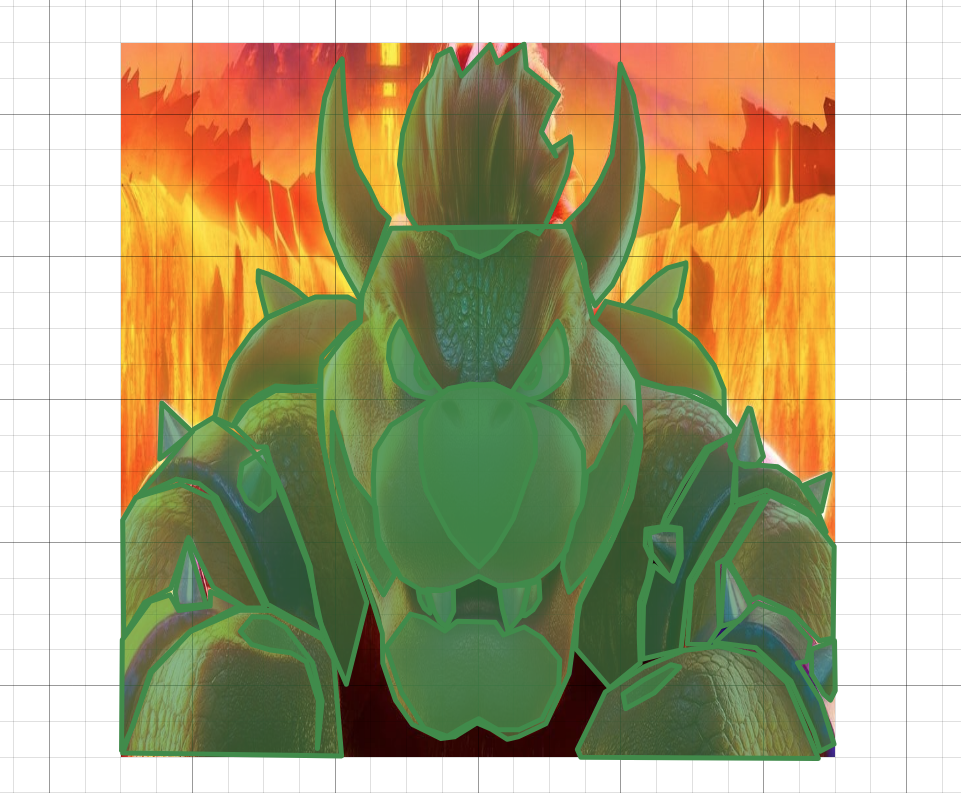
Also had to make sure to upload an image to trace if needed. Just like an online stencil (As I said, I’m not good at drawing).
Step 9: The final step
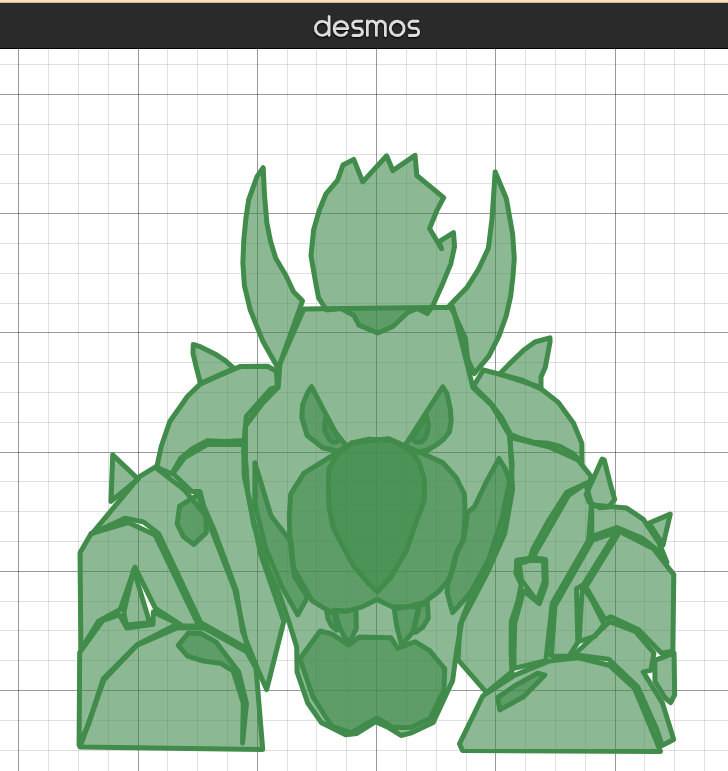
Here, I tested my functionality by drawing Bowser from Super Mario Bros. But you could draw anything. The sky’s the limit.
\
Conclusion
Well, I know this isn’t exactly the most practical for daily life (Photoshop has much more features to draw than this), but you should totally do this anyway, as you can go flex on your friends with this. If you really wanted to torture yourself with more high school graph equations you could do all the calculations manually and make a similar drawing. But it is so much easier and faster to just drag and drop. Best creative flex ever.
\
This content originally appeared on HackerNoon and was authored by Vincent
Vincent | Sciencx (2024-10-27T19:35:46+00:00) Making A Drawing Application on the Desmos Graphing Calculator. Retrieved from https://www.scien.cx/2024/10/27/making-a-drawing-application-on-the-desmos-graphing-calculator/
Please log in to upload a file.
There are no updates yet.
Click the Upload button above to add an update.