This content originally appeared on HackerNoon and was authored by 2minlog
I have always wondered about the HDDs temperature in my NAS. I have the NAS in a closed room without an airco. Moreover, I disassembled the NAS some time ago, and the discs were really hot… I did not measure the temperature back then, but I started to be worried. You can find many discussions on NAS drive temperature and monitoring it from a Linux/Python environment. But none of the solutions worked for me!
\ What I wanted:
- NAS HDD temperature monitoring in a reliable, documented manner - I did not want to read the value from some part of the Linux subsystem, which may change the next release of NAS software.
- I wanted to see my home NAS and my backup NAS, which is in my brother's basement, in one graph.
- I wanted to see the values in a cool-looking graph. I wanted total flexibility in the graph look, preferably setting it up by myself in Matplotlib.
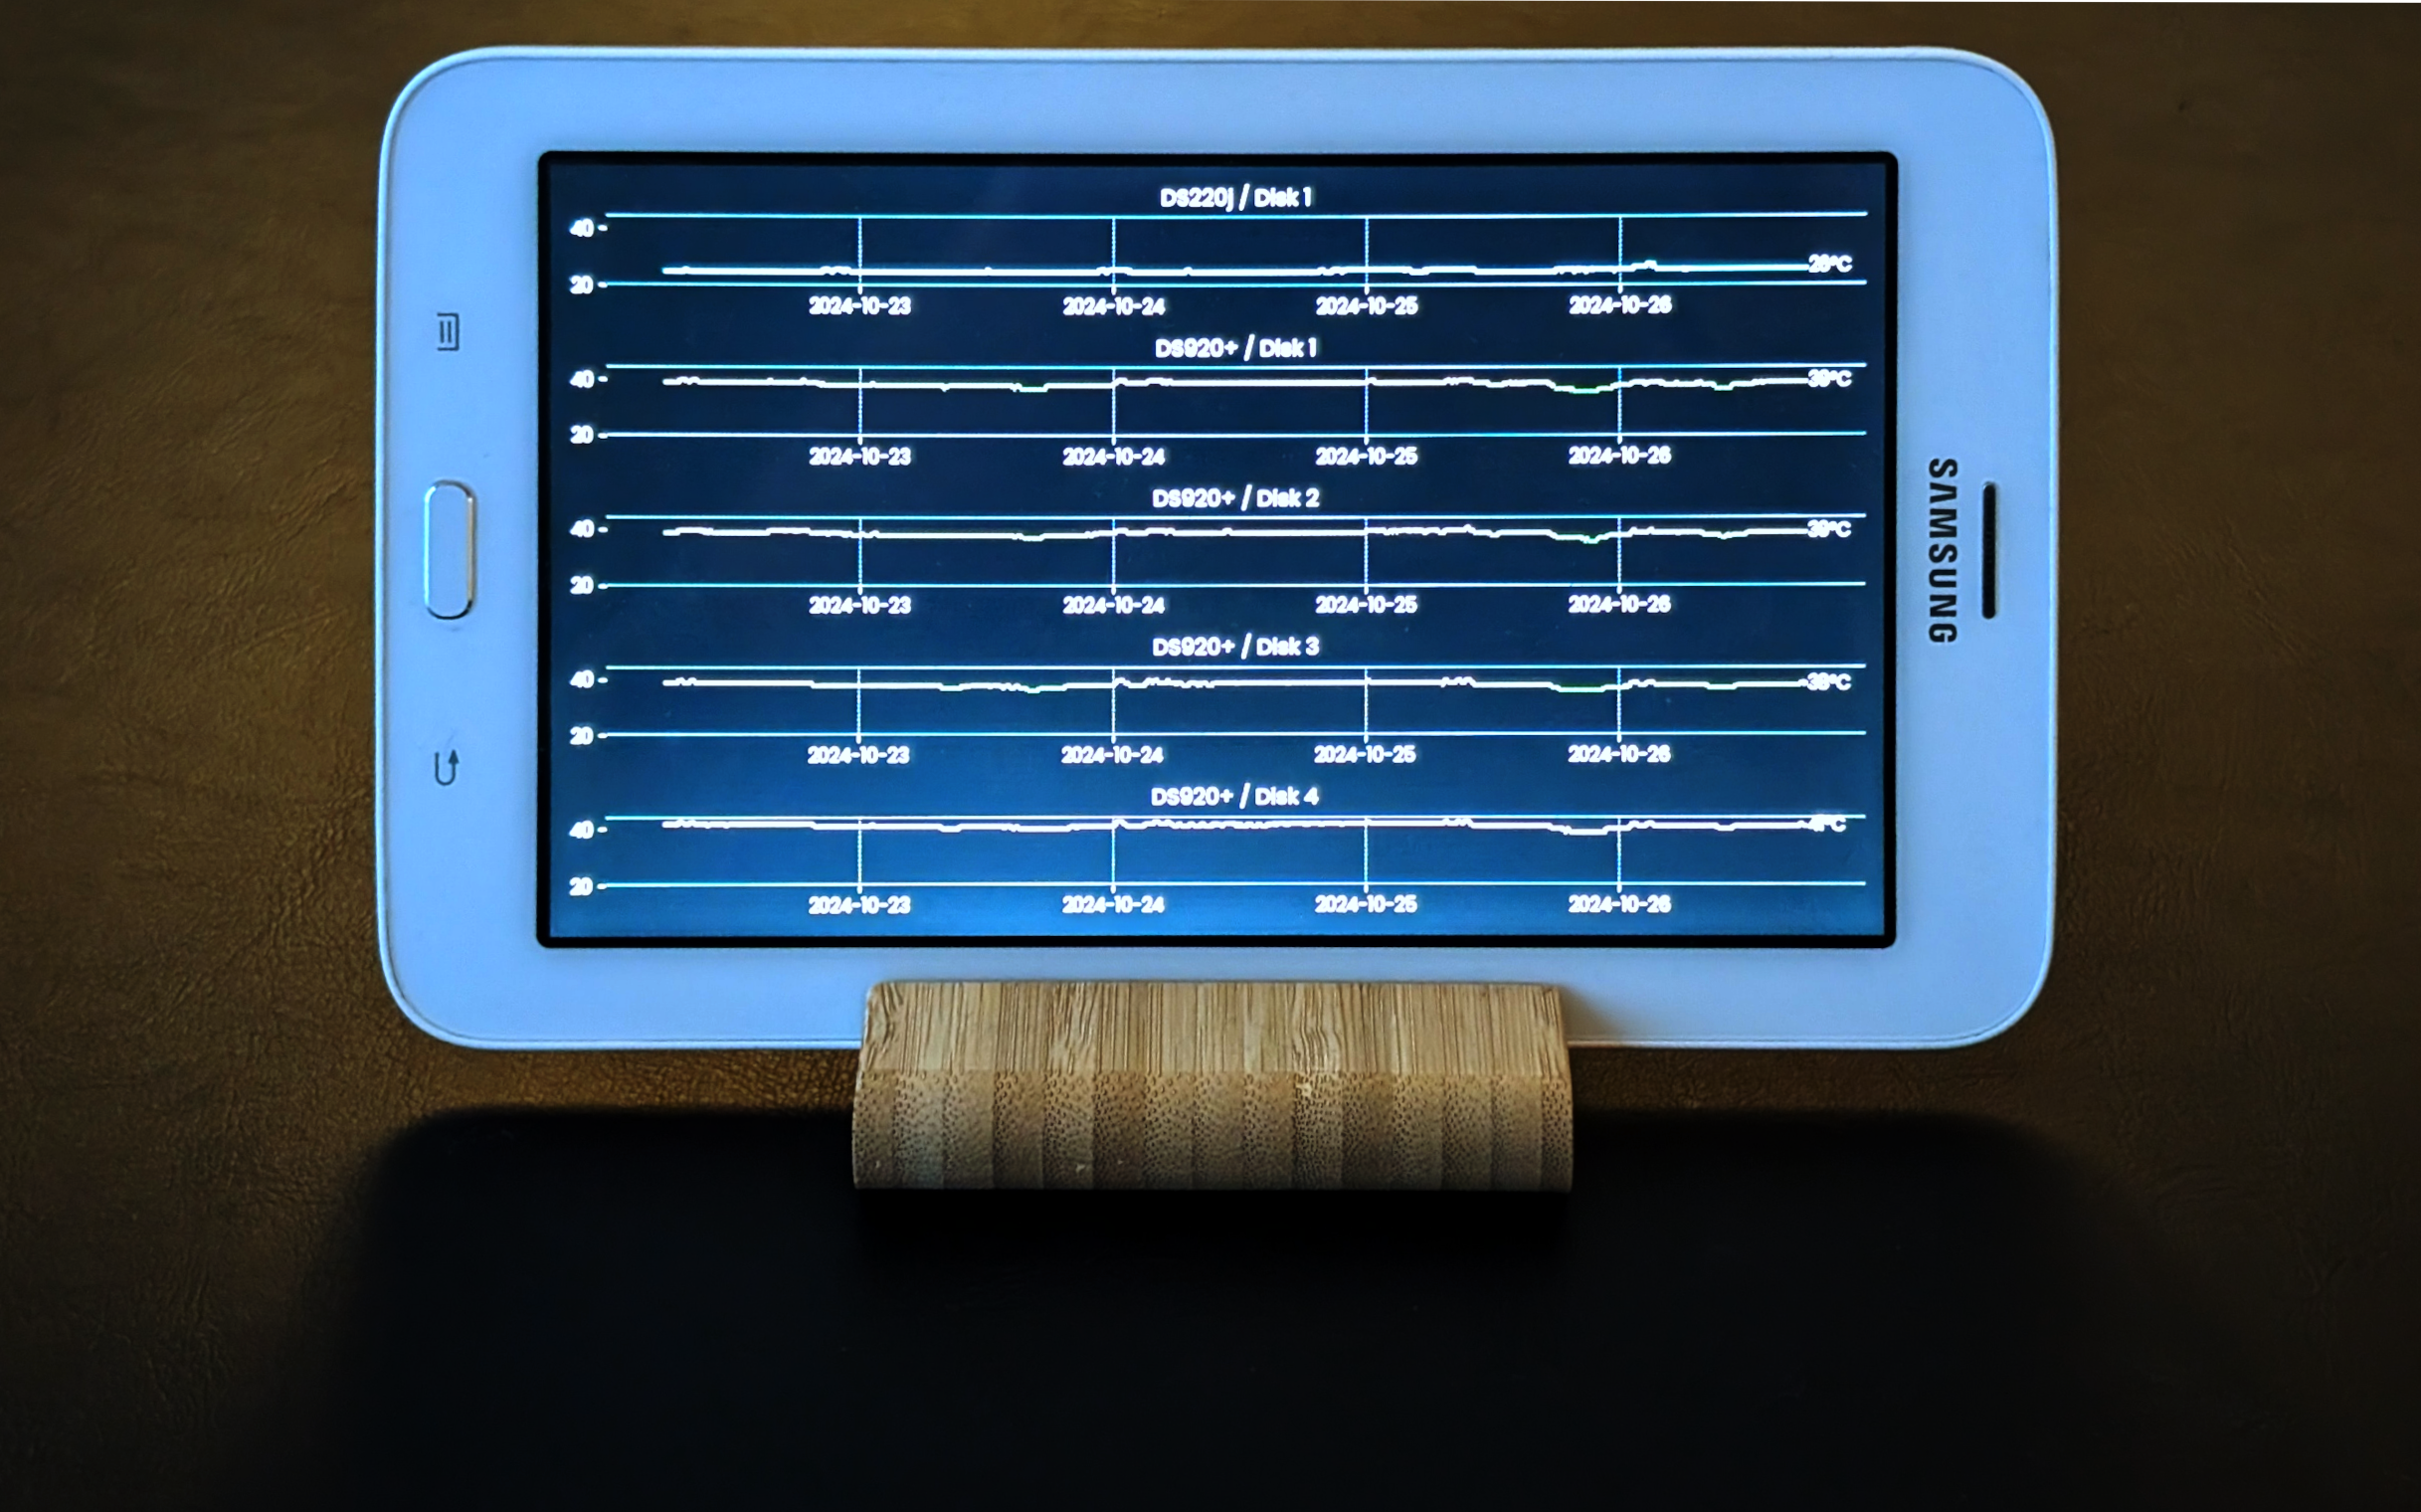
- I want to be able to take the values out of the NAS dashboard and display graphs in real time. I have a 2minlog display sitting on my desk. It already shows the temperature, humidity, and pollution levels on my balcony and the history of my internet connection availability. I want to see the HDD temperature history there.
\

Step 1: Gathering the temperature data
We will gather data via SNMP protocol via the pysnmp package.
\
Understanding SNMP and MIBs
SNMP (Simple Network Management Protocol) is a widely used protocol for monitoring the health and performance of network devices. It allows for the collection of data such as temperatures, CPU usage, and disk status.
MIBs (Management Information Bases) are databases of information that can be queried via SNMP. Each piece of data is identified by an OID (Object Identifier), which uniquely identifies a variable that can be read or set via SNMP.
\ You need to specify the MIB values to gather. I have Synology NAS. They publish the MIB file on their pages. We need to gather:
- Disk name: 1.3.6.1.4.1.6574.2.1.1.2
- Disk model: 1.3.6.1.4.1.6574.2.1.1.3
- Disk temperature: 1.3.6.1.4.1.6574.2.1.1.6
\ There is an excellent chatbot on the pysnmp page. It wrote the body of the Python script for me, handling all the difficulties with SNMP API and handling async calls. The key section follows:
async def run(server_name, ipaddress, username, passwd, outinfo):
# SNMP walk for disk name, model, and temperature
  oids = [ ObjectType(ObjectIdentity('1.3.6.1.4.1.6574.2.1.1.2')),  # Disk name (diskID)
    ObjectType(ObjectIdentity('1.3.6.1.4.1.6574.2.1.1.3')),  # Disk model (diskModel)
    ObjectType(ObjectIdentity('1.3.6.1.4.1.6574.2.1.1.6'))   # Disk temperature (diskTemperature)
  ]
  errorIndication, errorStatus, errorIndex, varBinds = await bulkCmd(
    SnmpEngine(),
    UsmUserData(username, passwd, authProtocol=usmHMACSHAAuthProtocol),  # Use the appropriate auth protocol
    await UdpTransportTarget.create((ipaddress, 161)),
    ContextData(),
    0, 10,  # Increase the max-repetitions to get more results in one request
    *oids  # Query disk name, model, and temperature
  )

  if errorIndication:
    print(f"Error: {errorIndication}")
  elif errorStatus:
    print(f"Error Status: {errorStatus.prettyPrint()} at {errorIndex and varBinds[int(errorIndex) - 1] or '?'}")
  else:
    disk_data = {}
    for varBind in varBinds:
        oid, value = varBind
        oid_str = str(oid)

        # Disk name
        if oid_str.startswith('1.3.6.1.4.1.6574.2.1.1.2'):
            index = oid_str.split('.')[-1]
            if index not in disk_data:
                disk_data[index] = {}
            disk_data[index]['name'] = value

        # Disk model
        elif oid_str.startswith('1.3.6.1.4.1.6574.2.1.1.3'):
            index = oid_str.split('.')[-1]
            if index not in disk_data:
                disk_data[index] = {}
            disk_data[index]['model'] = value

        # Disk temperature
        elif oid_str.startswith('1.3.6.1.4.1.6574.2.1.1.6'):
            index = oid_str.split('.')[-1]
            if index not in disk_data:
                disk_data[index] = {}
            disk_data[index]['temperature'] = value

    # Print out the disk information
    for index, info in disk_data.items():
        name = info.get('name', 'Unknown')
        model = info.get('model', 'Unknown')
        temperature = info.get('temperature', 'Unknown')

        name = str(name)
        model = str(model)
        temperature = str(temperature)

        print(f"IP Address {ipaddress}, Disk {index}: Name: {name}, Model: {model}, Temperature: {temperature} °C")
        outinfo.append({'server_name': server_name, 'ip': ipaddress, 'disk': index, 'name': name, 'model': model, 'temperature': temperature})
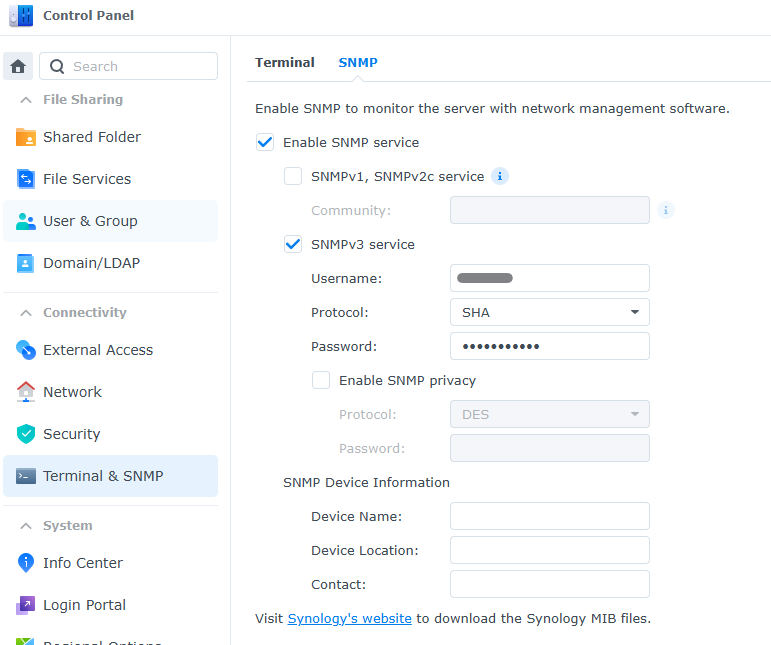
\ You need to enable the SNMP protocol in the Synology NAS settings:

Step 2: Deploy the script and send data for processing
I deployed the script directly on the NAS in the Docker environment. You must ensure that the Docker container starts again after the eventual restart. I’ve set up a simple docker-compose.yaml file for that reason:
version: '3.8'

services:
  pingchart:
    build: .
    restart: always
    container_name: synology-temperature
Then start the Docker with docker-compose up -d.
\
I am affiliated with the 2minlog - a simple system to gather, process, and visualize data. You send the data there via HTTPS requests (encoded in the URL or in the body) and set up a visualization script there. The graphs are then readily available from anywhere you need.
\ You can use the 2minlog. Alternatively, you can send the data to a database or local file system.
Step 3: Visualization of data
I set up a simple Matplotlib script to display the graph. Actually, I asked ChatGPT (o1-preview) to do it, and it did pretty well. The Python script was not perfect, but it was it was good enough to finish the task quickly. The prompt is below.
Here is a csv file. Can you write a code:
Split data into different graphs by combining the server name and name (e.g., DS920+ / Disk 1).
Each graph will show the temperature.
There will be a title in each graph (e.g., DS920+ / Disk 1)
The graphs will have the same temperature range.
The background will be black, graph background will be also black, the graph color will be from dark green (low temperatures) to light green (high temperatures).
There will be two thin lines - 20 °C (blue) and 45 °C (red).
Trim the data for last week with tickmarks at midnight of every day.
The data are in UTC time. Convert it to Europe/Berlin time zone.
The resolution of the total image is h x w 600 x 1024 pixels.
Save the image to PNG.

disk,ip,model,name,server_name,temperature,timestamp
0,10.0.0.9,ST4000VN008-2DR166,Disk 3,DS920+,38,2024-09-19T20:19:48.723761
1,10.0.0.9,ST16000NM000J-2TW103,Disk 4,DS920+,42,2024-09-19T20:19:49.253975
2,10.0.0.9,ST4000VX007-2DT166,Disk 1,DS920+,38,2024-09-19T20:19:49.818734
3,10.0.0.9,ST4000VX007-2DT166,Disk 2,DS920+,39,2024-09-19T20:19:50.393793
0,10.0.2.9,ST12000NM001G-2MV103,Disk 1,DS220j,28,2024-09-19T20:19:50.873142
0,10.0.0.9,ST4000VN008-2DR166,Disk 3,DS920+,38,2024-09-19T20:20:02.119583
1,10.0.0.9,ST16000NM000J-2TW103,Disk 4,DS920+,42,2024-09-19T20:20:02.596654
2,10.0.0.9,ST4000VX007-2DT166,Disk 1,DS920+,38,2024-09-19T20:20:03.101480
3,10.0.0.9,ST4000VX007-2DT166,Disk 2,DS920+,39,2024-09-19T20:20:03.697423
0,10.0.2.9,ST12000NM001G-2MV103,Disk 1,DS220j,28,2024-09-19T20:20:04.221348
0,10.0.0.9,ST4000VN008-2DR166,Disk 3,DS920+,38,2024-09-19T20:25:02.254611
1,10.0.0.9,ST16000NM000J-2TW103,Disk 4,DS920+,42,2024-09-19T20:25:02.714633
2,10.0.0.9,ST4000VX007-2DT166,Disk 1,DS920+,38,2024-09-19T20:25:03.295622
3,10.0.0.9,ST4000VX007-2DT166,Disk 2,DS920+,39,2024-09-19T20:25:03.780728
...
\ The visualization script is deployed within the 2minlog platform. You can also run it locally.
\ The script is available on GitHub.
Wrapping it up
You can use a fully managed 2minlog to gather, process, and visualize the data. Check out the documentation. I display the results on an Android tablet sitting on my table and cycle by the various graphs with Image Tuner. You can also save the data on your local file system and do the same.
\ The solution is tested on a Synology NAS, but can be adapted for others.
References:
- GitHub Repository: NAS Temperature Monitoring Project
- Pysnmp documentation: pysnmp Library
- Pysnmp package chatbot: SNMP guru
- Display setup: Full Screen Autorefresh and Setup Old Android Tablet as a Display
- Synology MIB Files**:** Synology MIB Guide
- 2minlog: 2minlog data visualization platform
\ #Synology #SynologyNAS #Temperature #Monitoring #DataVisualization #Matplotlib #SNMP #2minlog #Python #Docker
This content originally appeared on HackerNoon and was authored by 2minlog
2minlog | Sciencx (2024-10-31T14:15:28+00:00) Python + SNMP = Real-Time NAS Disk Temperature Monitor!🌡️ Learn How I Did It. Retrieved from https://www.scien.cx/2024/10/31/python-snmp-real-time-nas-disk-temperature-monitor%f0%9f%8c%a1%ef%b8%8f-learn-how-i-did-it/
Please log in to upload a file.
There are no updates yet.
Click the Upload button above to add an update.
