This content originally appeared on HackerNoon and was authored by johnnyfish
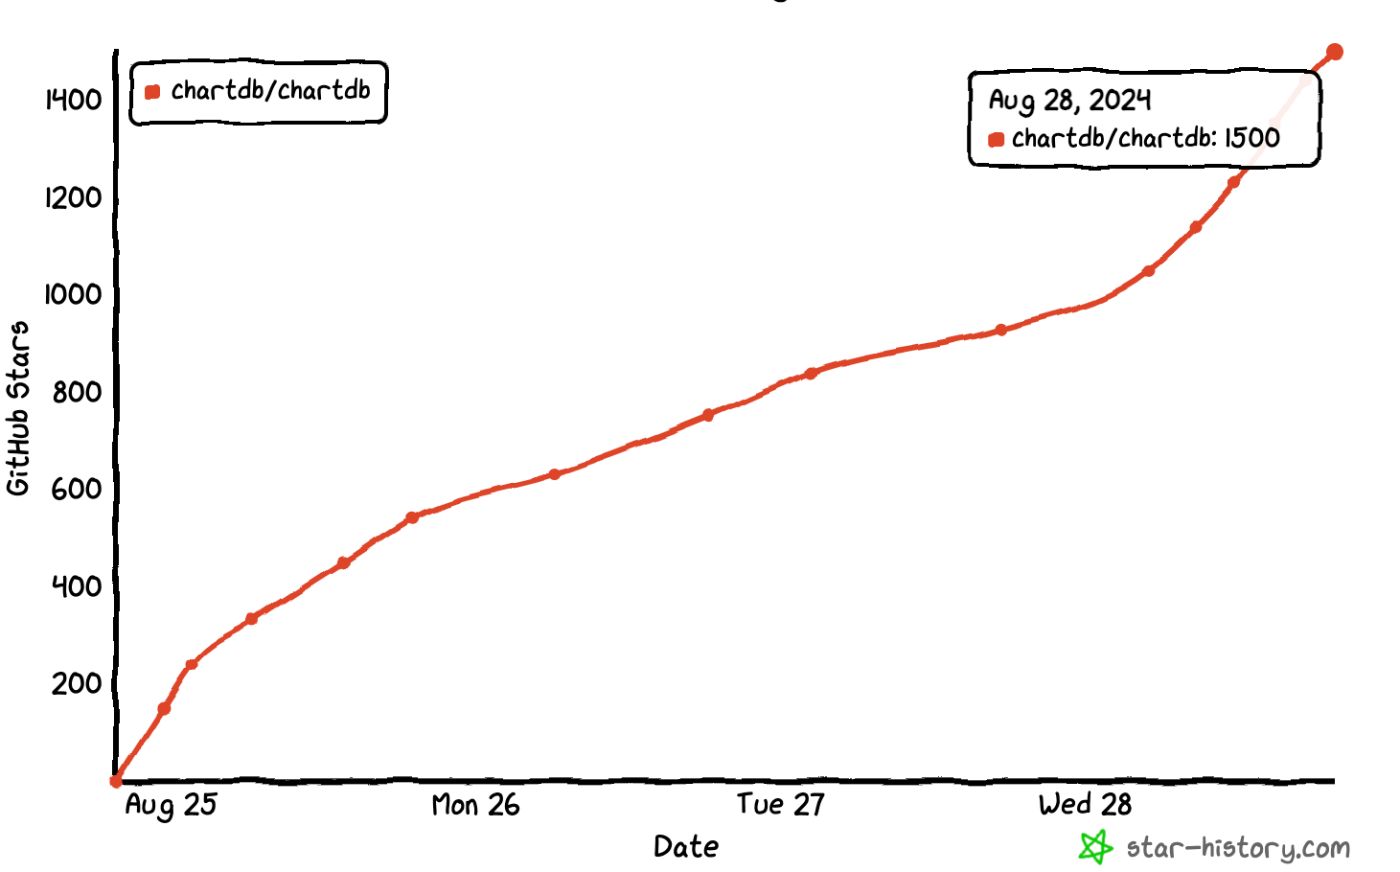
\ In a world moving faster than ever, the demands for intuitive, developer-centric tools are reshaping the landscape. My co-founder, Guy Ben-Aharon, and I launched ChartDB not just as another database tool, but as a leap forward in how we design and interact with data. Within just three days, ChartDB took off on GitHub, amassing over 1,500 stars-an overwhelming response that shows the hunger for accessible database visualization.
\
\

Why ChartDB Stands Out in a Crowded Field
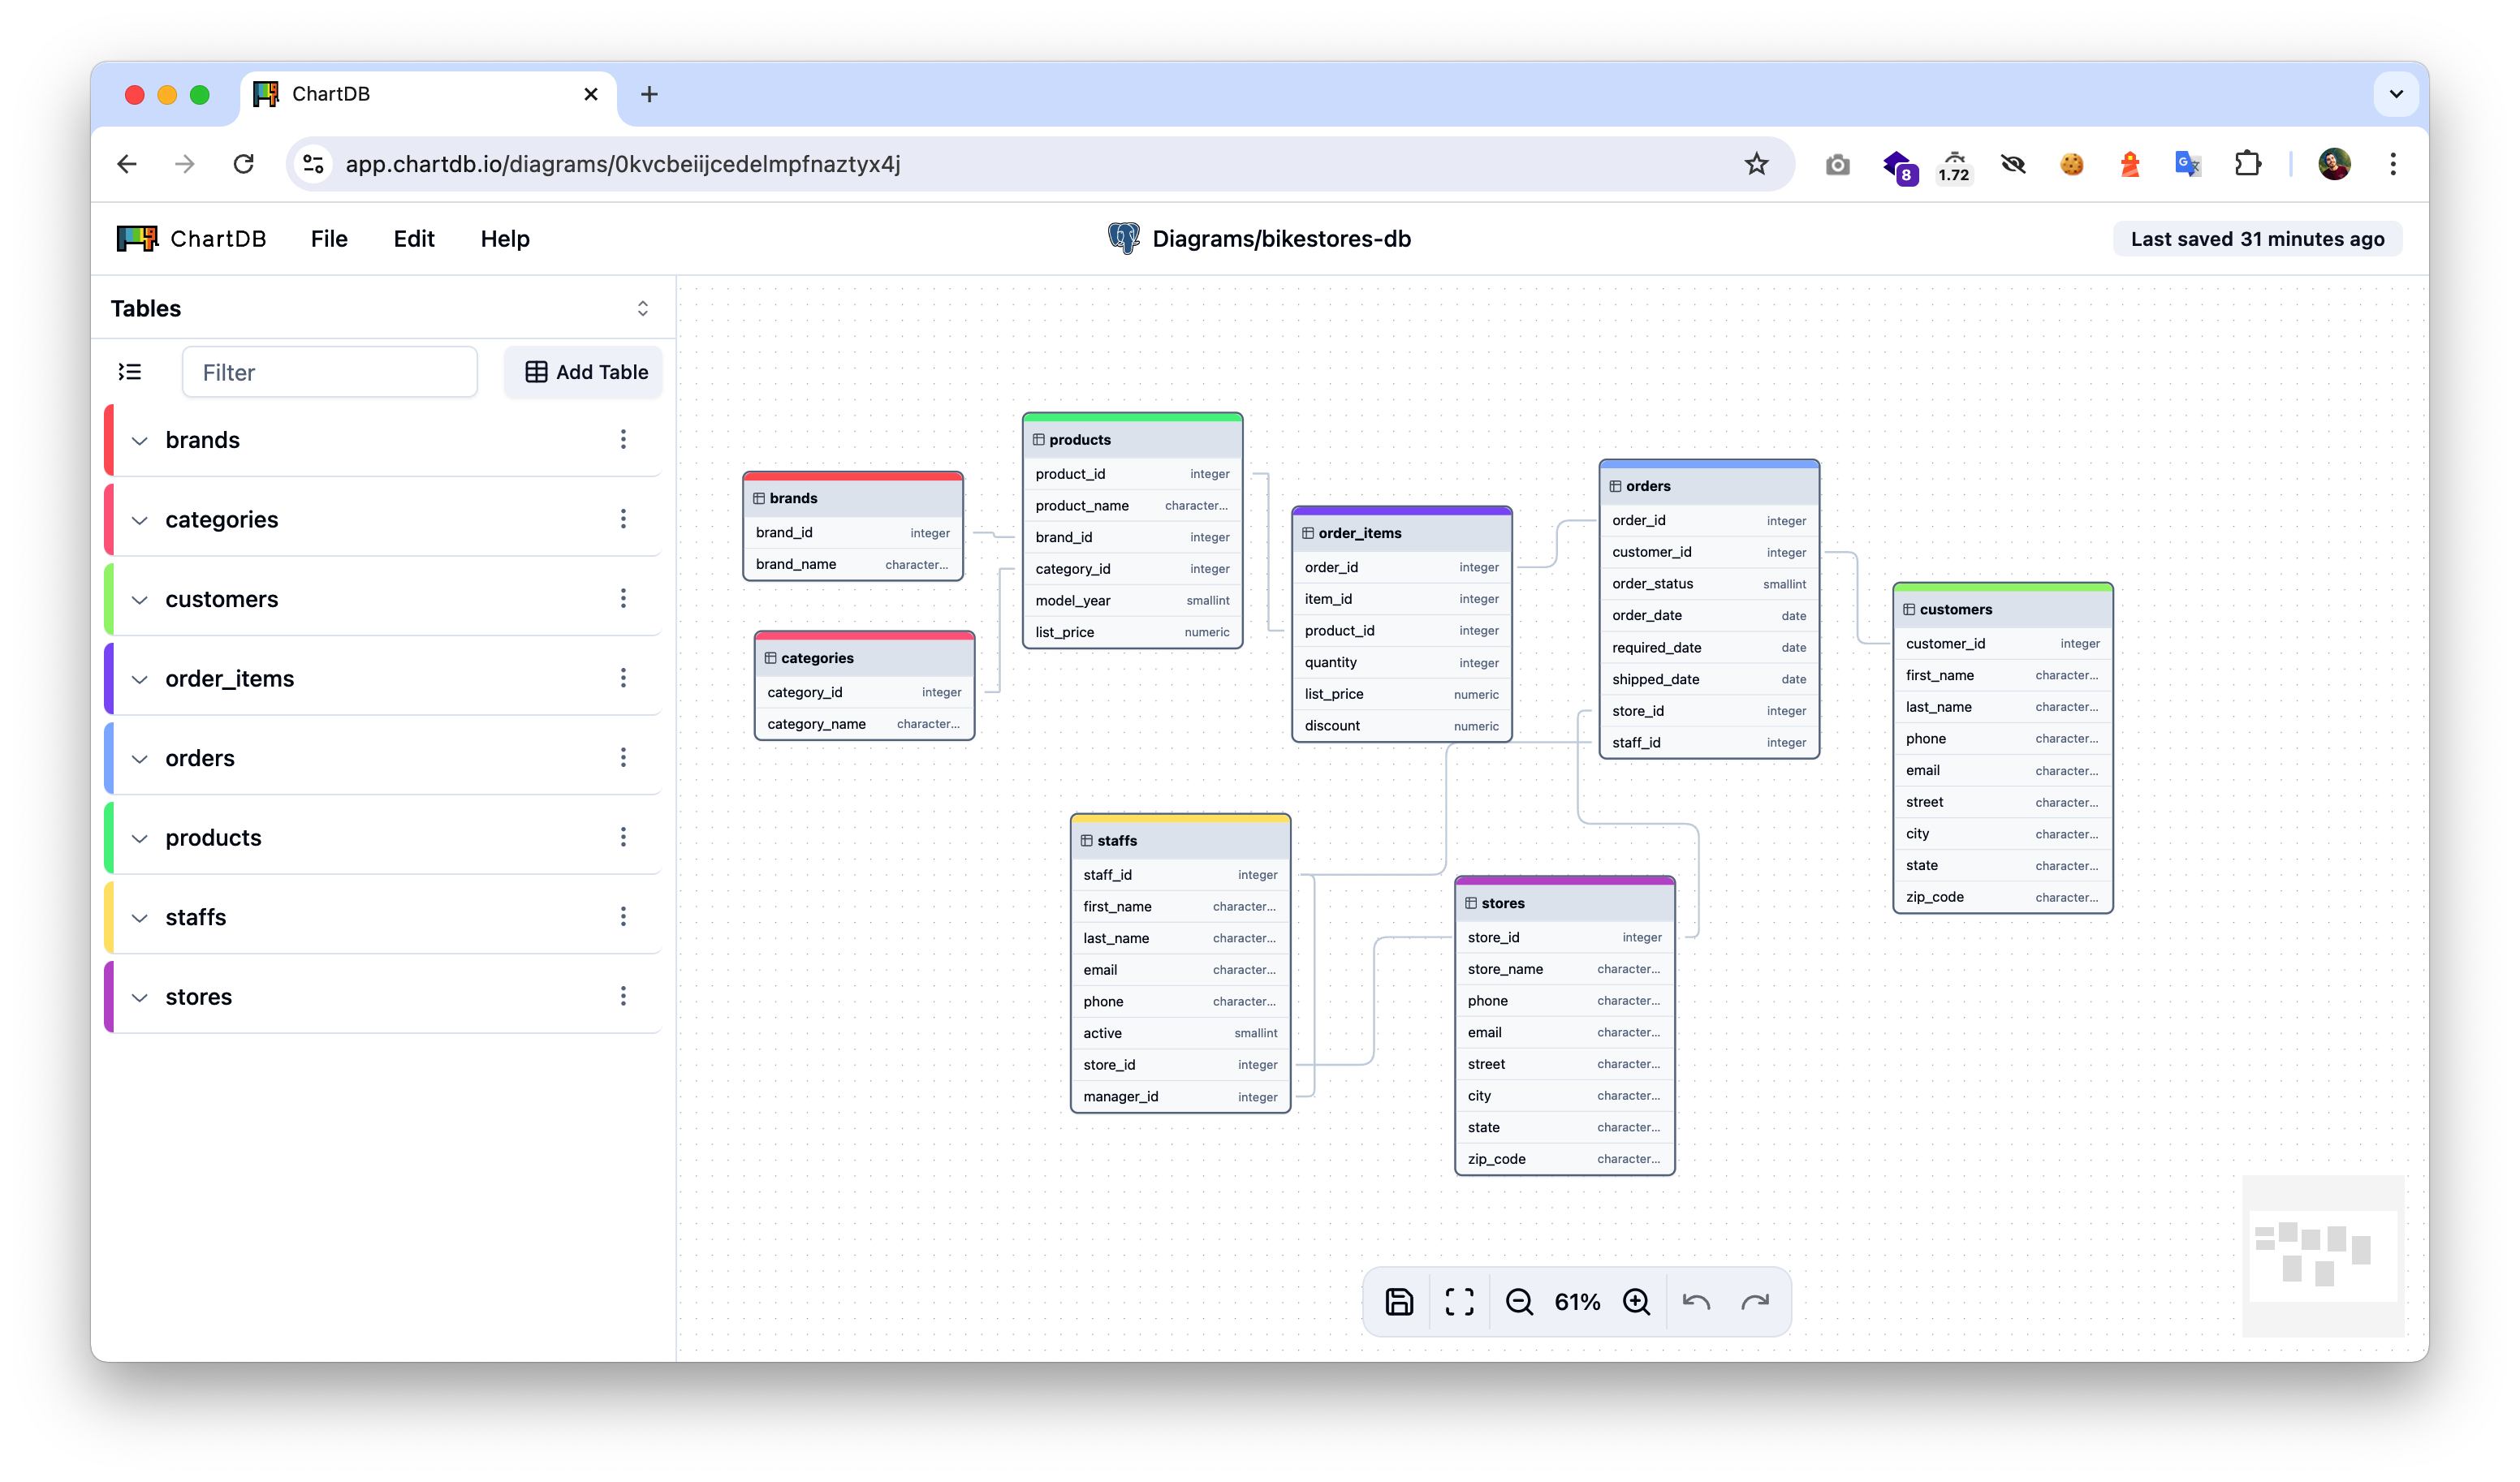
Developers need tools that streamline workflow without compromising on power. ChartDB does just that. By delivering an intuitive, user-friendly interface, we’ve made database visualization and management both approachable and powerful. From newcomers to database experts, ChartDB adapts to fit every level of expertise. Our community on Discord is filled with users who’ve shared how ChartDB is transforming their work, and their feedback keeps driving us forward.
Built in Three Weeks, Fueled by a Vision
ChartDB’s rapid development was no accident. In just three weeks, we transformed an idea into a fully functional tool, coding late nights and early mornings. And while the journey was intense, advancements in AI tools like Code Cursor and Claude 3.5 Sonnet have paved the way for even faster development. Now, we’re in a position to accelerate future builds, equipped with these groundbreaking resources that bring ideas to life at unprecedented speeds.
\

ChartDB’s Future: What’s Next on the Horizon
Our journey with ChartDB has just begun. Here’s a glimpse into what’s coming:
- AI-Driven Features: We’re working on AI integrations that will supercharge ChartDB’s capabilities, making database management smarter and more intuitive.
- Community-Powered Growth: We’re committed to keeping open lines of communication with our community. Your input will shape ChartDB’s evolution as we continue adding features that you want.
- Expanding Functionality: User suggestions are at the core of our roadmap. We’re excited to bring new features that make database design and visualization seamless.
Join the Movement 🚀
If you haven’t tried ChartDB yet, now’s the time. Explore the demo, star us on GitHub, and let us know what you think. The support we’ve received fuels our ambition to innovate and set a new standard in database visualization.
\ In our next post, we’ll share insights from our Hacker News launch, our strategies, and what we learned through the experience. Join us as we continue pushing boundaries in database technology.
Shaping the Future of Development Together
AI and automation aren’t just trends; they’re transforming how we approach development. Whether you’re a seasoned developer or just starting out, the possibilities are endless. Drop a comment below with your thoughts or feedback, or just say hello. Together, let’s build something incredible.
\

Feel free to share your thoughts, feedback, or just say hello in the comments below. Let’s connect and build something amazing.
This content originally appeared on HackerNoon and was authored by johnnyfish
johnnyfish | Sciencx (2024-11-05T10:17:27+00:00) ChartDB: Pioneering the Future of Database Visualization ✨. Retrieved from https://www.scien.cx/2024/11/05/chartdb-pioneering-the-future-of-database-visualization-%e2%9c%a8/
Please log in to upload a file.
There are no updates yet.
Click the Upload button above to add an update.

