
This content originally appeared on HackerNoon and was authored by Giuseppe Baglio
Learn how to read thread dumps and take control of your application’s runtime behaviour.
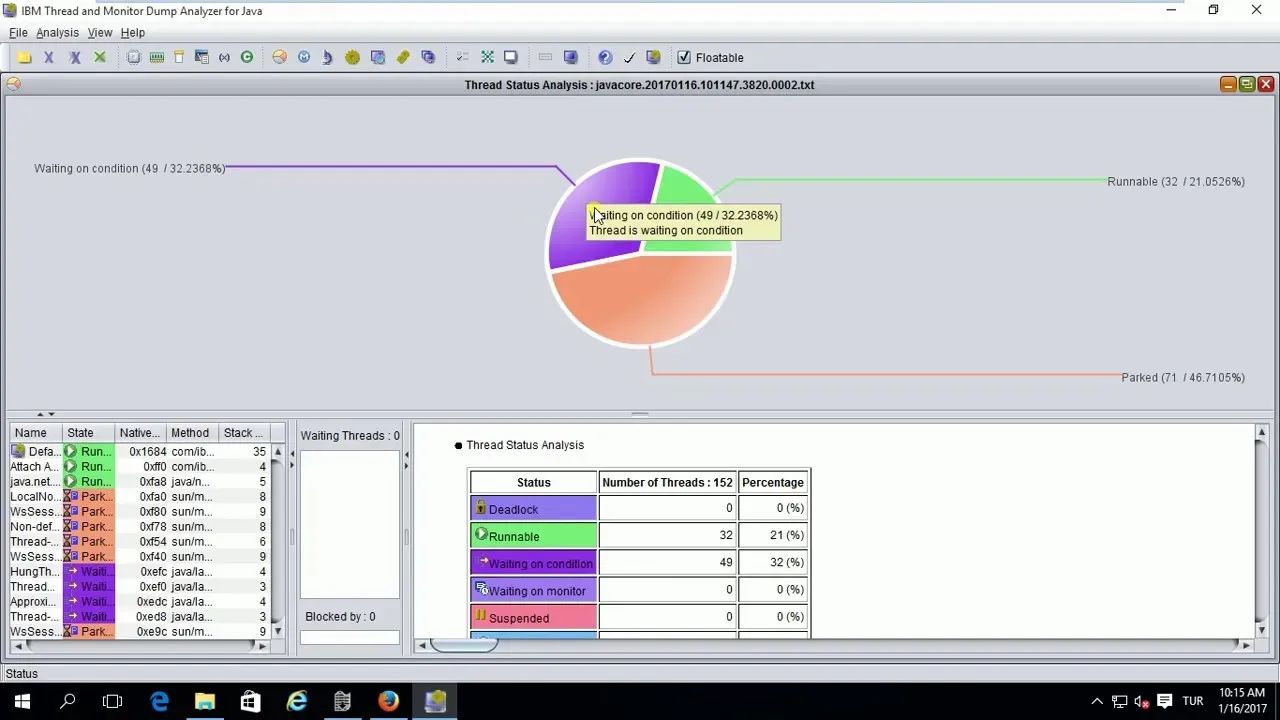
\ When your Adobe Experience Manager (or in general any JAVA application) instance shows signs of sluggishness, it’s time to roll up your sleeves and dive into the world of thread dumps. IBM Thread Analyzer (TDA) is here to help you untangle the web of threads and pinpoint performance bottlenecks. In this guide, we’ll walk you through how to use IBM TDA to diagnose performance issues in AEM like a pro.
\
\
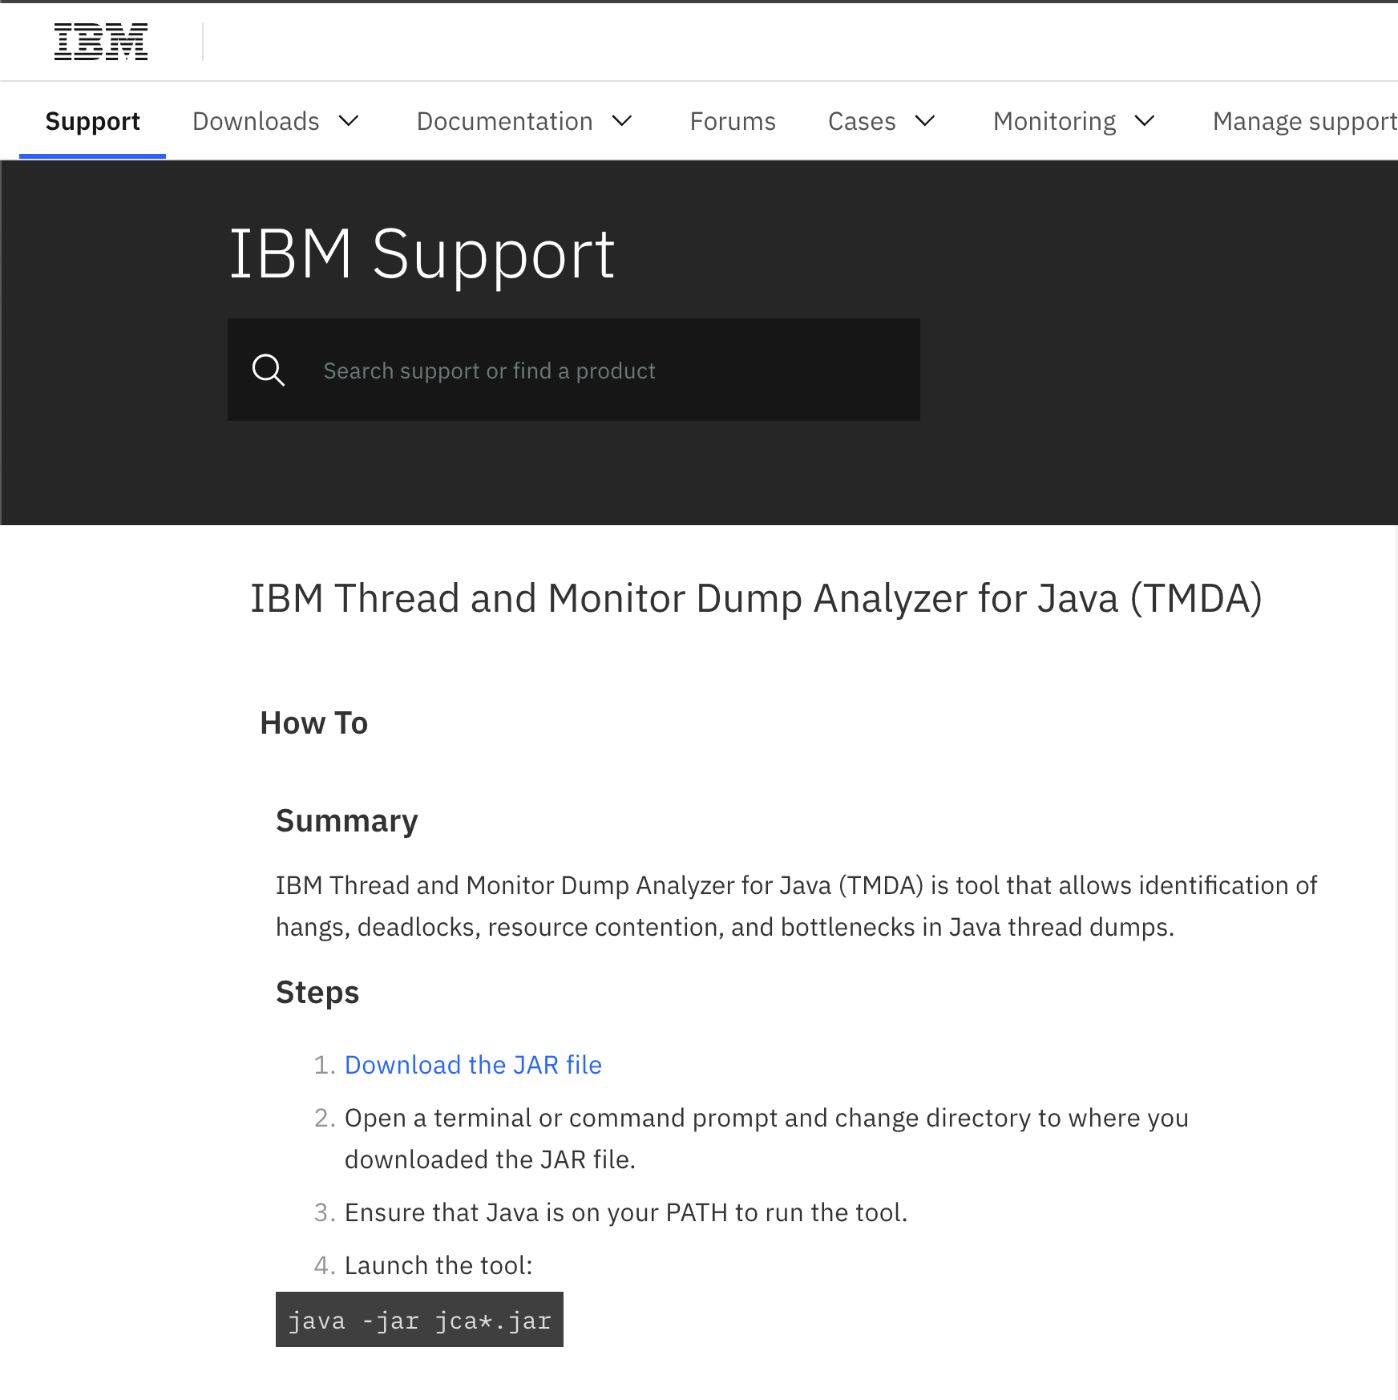
Step 1: Download and Install IBM TDA
Before you can start analyzing thread dumps, you’ll need to download and install IBM Thread Analyzer. Head over to the official IBM website or your organization’s repository to grab the latest version. Once downloaded, follow the installation instructions for your operating system. It’s quick, easy, and sets the stage for some serious troubleshooting.
\
\
\
Step 2: Capture Thread Dumps from Your AEM Instance
Thread dumps are snapshots of all the threads running in your AEM instance at a specific moment. To capture them:
- Access your AEM server.
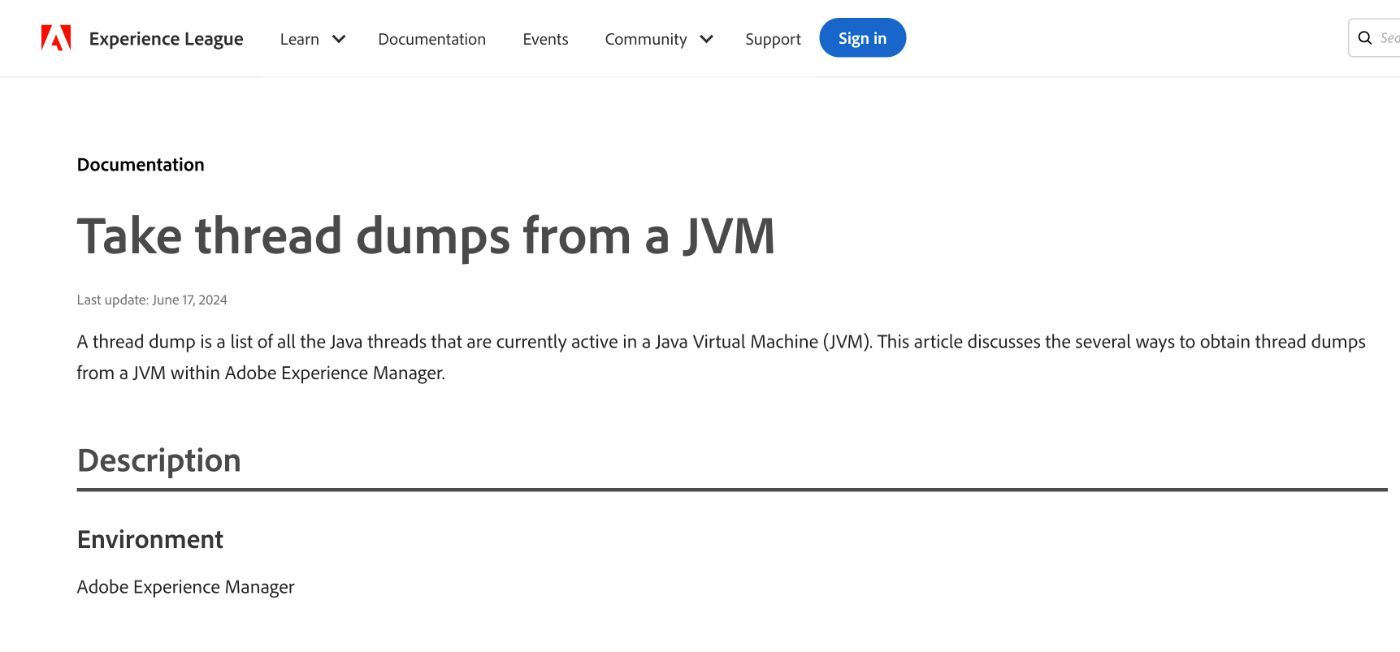
- Use tools like
jstack,kill -3, or AEM’s built-in functionality to generate thread dumps. There is a well-documented page on Adobe Docs. - Save the thread dump files to your local machine.
\
\ Pro Tip: Capture multiple thread dumps at intervals (e.g., every 10 seconds) to get a clearer picture of long-running issues.
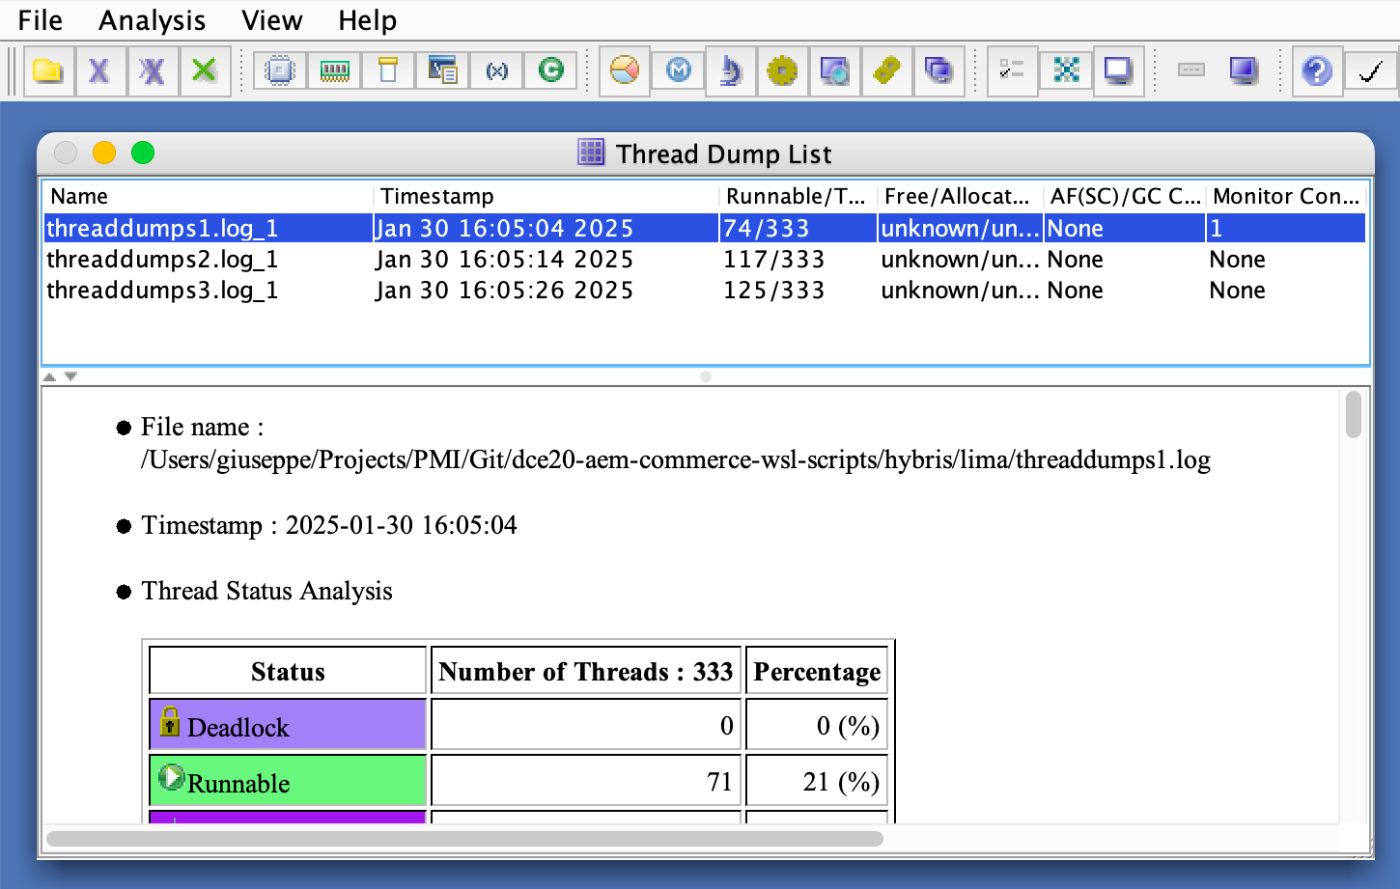
Step 3: Open the Thread Dumps in IBM TDA
Launch IBM TDA and open the thread dump files you’ve captured. Simply drag and drop the files into the application or use the “Open” option to load them. Once loaded, you’ll see a list of thread dumps on the left-hand panel.
\
Step 4: Dive into Thread Details
To analyze a specific thread dump:
Select the file from the listing.
Click the Thread Detail button at the top

\ This will display a detailed view of all the threads in that dump. Now, let’s sort the threads by Stack Depth, ensuring the longest stacks appear at the top. Why? Threads with deeper stacks often indicate more complex operations, which are usually where performance issues hide.
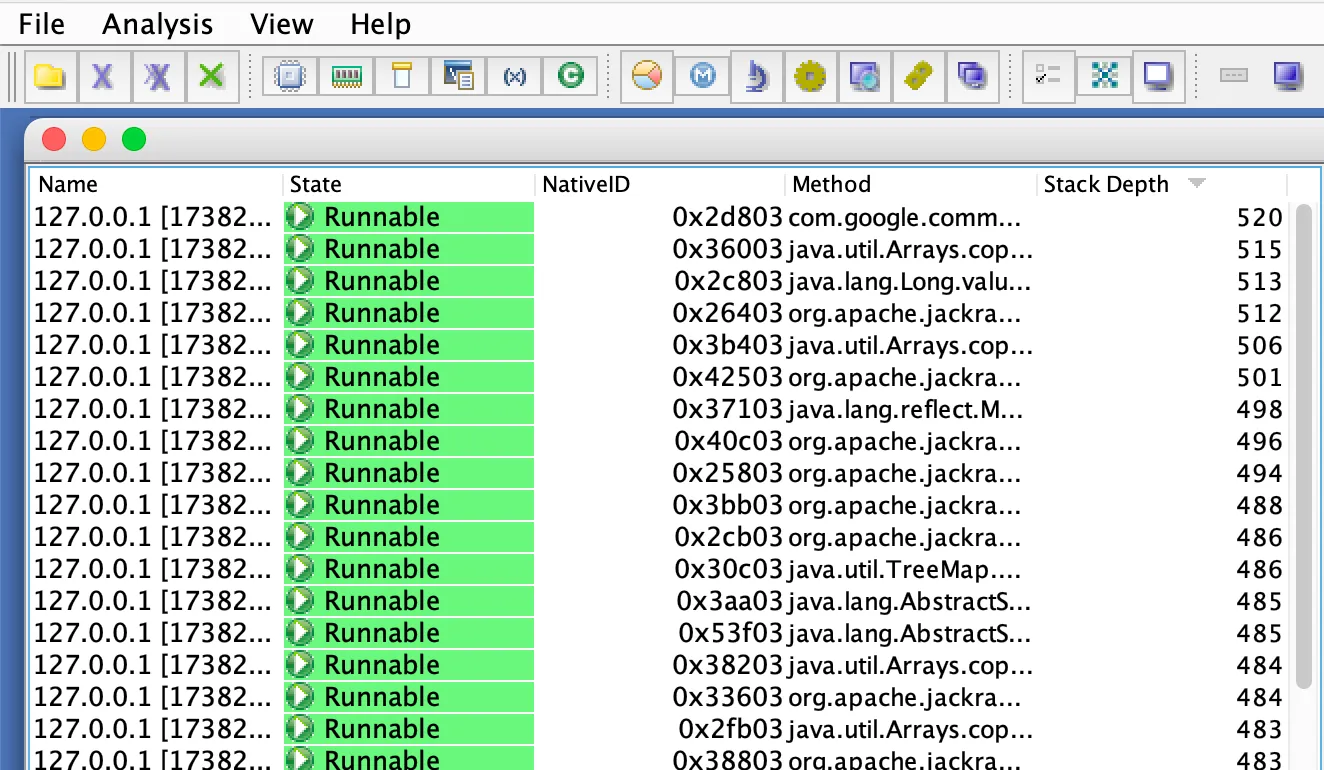
Step 5: Identify Threads of Interest
Focus on threads with a stack depth of 10 lines or longer. These threads are typically the ones consuming the most resources. Take notes on any threads that stand out — whether due to their names, states, or stack traces.
Step 6: Sort by Thread State
Next, sort the threads by their State. Scroll down to the Runnable threads. These are the threads that were actively using CPU time when the dump was taken. Keep an eye out for application-specific threads, such as:
Background job threads: Handling tasks like indexing or replication.
Request threads: Named like
127.0.0.1 [timestamp] GET /path HTTP/1.1.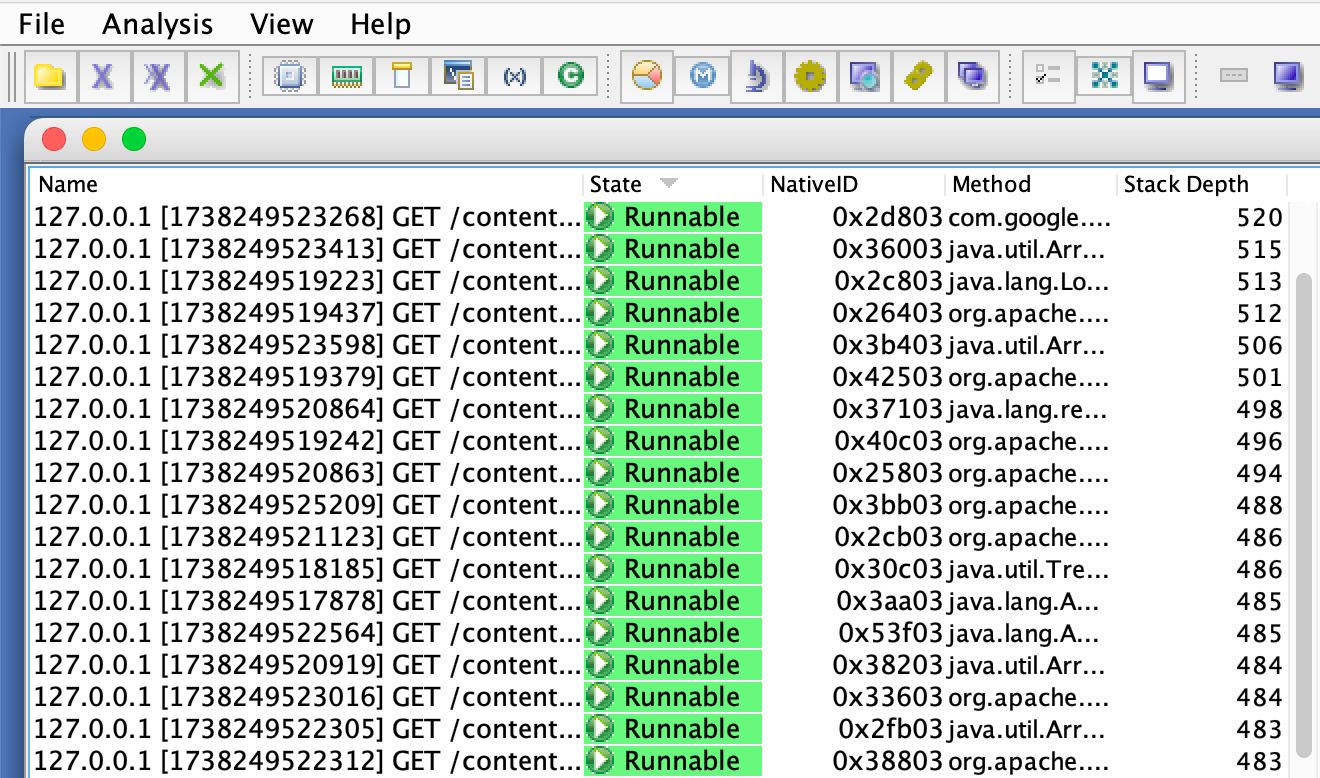
\
Step 7: Decode Request Timestamps
For each request thread, extract the timestamp from its name (e.g., 1347028187737). This Unix epoch timestamp tells you when the user’s browser made the request. Convert it to a human-readable date/time using a tool like https://www.epochconverter.com/. Compare this with the thread dump’s timestamp to calculate how long the request has been active.
If the difference is unusually large (e.g., several seconds or minutes), it could indicate a bottleneck in your application.
\ Pro Tip: Keep an eye out for patterns. Are certain types of requests consistently taking longer? For example, requests involving complex queries or resource-heavy operations might be worth optimizing. Additionally, if you notice that specific URLs or endpoints are frequently associated with long-running threads, consider profiling those areas of your codebase.
Step 8: Investigate Waiting Threads
Thread analysis requires a nuanced approach that goes beyond simple waiting states. While the IBM Thread Analyzer (TDA) interface provides valuable insights into thread relationships, understanding the full context of thread behavior helps create a more complete picture of your application’s performance characteristics.
Understanding Thread States
When examining threads in TDA, you’ll encounter several important states:
Runnable: These threads are either currently executing or ready to execute when CPU time becomes available. A Runnable state doesn’t necessarily indicate a problem — it’s the natural state for actively working threads.
Waiting: These threads have temporarily paused execution while waiting for a condition to be met. The waiting state can occur for many legitimate reasons, including:
\
- Resource availability (database connections, file handles)
- Task completion in other threads
- Scheduled delays
- Network I/O completion
- Message queue operations
\
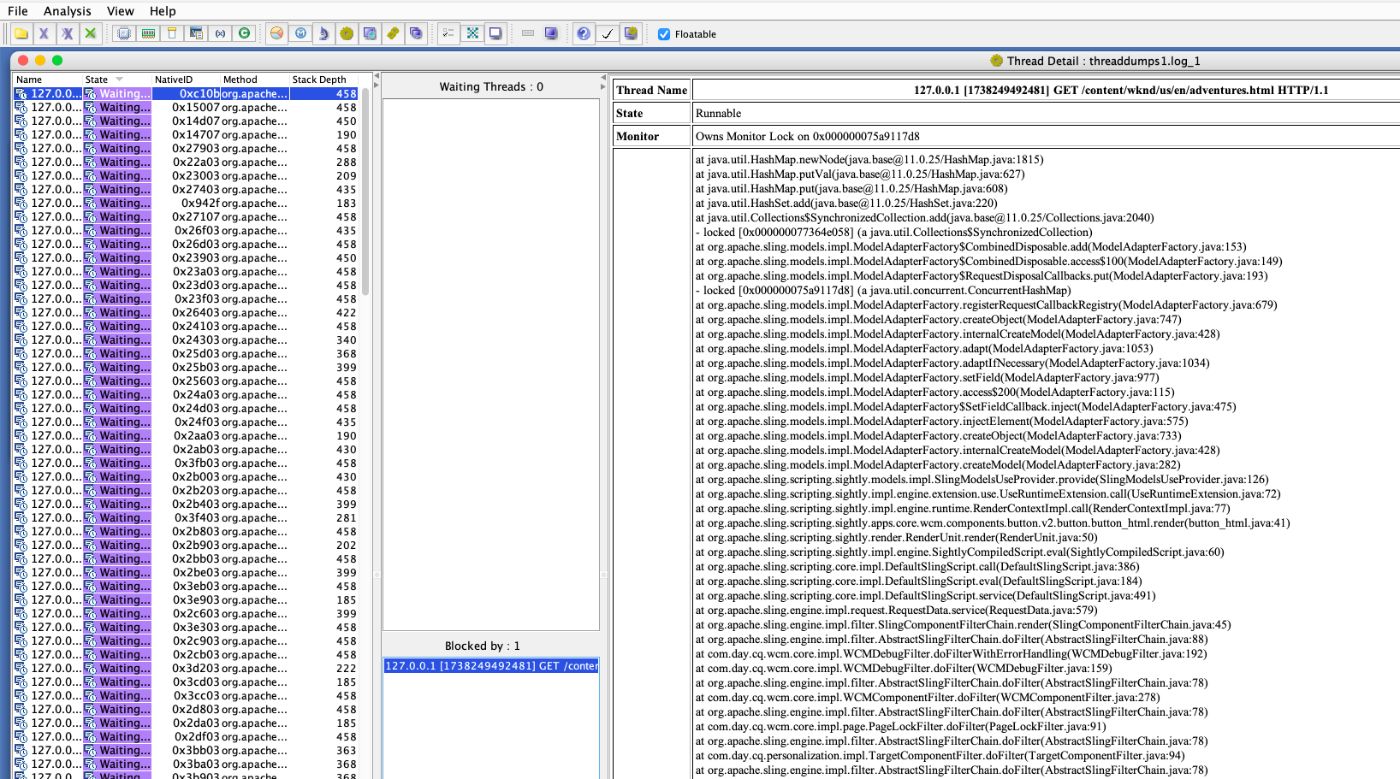
\ Blocked: These threads are specifically waiting to acquire a monitor or lock. While similar to waiting, blocked states specifically indicate synchronization-related pauses.
Analyzing Thread Relationships
When you identify a thread of interest, examine its relationships with other threads using this systematic approach:
- Direct Lock Relationships:
- Examine the Waiting Threads panel for immediate dependencies
- Review the stack traces of waiting threads to understand why they’re blocked
- Note the duration of the wait states if available
\ 2. Resource Usage Patterns:
- Look for patterns in resource acquisition and release
- Identify potential resource bottlenecks
- Consider alternative resource management strategies
\ 3. Architectural Implications:
- Evaluate if the observed behaviour aligns with the system’s design
- Consider if the current threading model is appropriate
- Assess the impact on scalability
Understanding Lock Types and Visibility
Thread dumps may not show all types of contention. Modern Java applications use various synchronization mechanisms:
- Intrinsic Locks (synchronized keyword):
- Visible in thread dumps
- Show clear owner-waiter relationships
- Stack traces indicate synchronization points
\ 2. Explicit Locks (java.util.concurrent):
- ReentrantLock
- ReadWriteLock
- StampedLock
- May require additional tooling to visualize
\ 3. Non-blocking Mechanisms (Don’t appear as traditional locks but can impact performance):
- Atomic variables
- ConcurrentHashMap
- CompletableFuture
Optimization Strategies
When you identify genuine contention issues, consider these approaches:
- Code-Level Improvements
- Reduce lock scope
- Implement finer-grained locking
- Consider non-blocking alternatives
\ 2. Resource Management
- Optimize pool sizes
- Implement backoff strategies
- Consider caching solutions
\ 3. Architectural Changes
- Evaluate asynchronous processing
- Consider parallel execution paths
- Implement queue-based approaches
\ Remember that thread analysis is an iterative process. Patterns that emerge in one thread dump might not represent consistent behaviour. Always validate your findings across multiple dumps and different time periods before making significant changes to your application.
Step 9: Compare Across Multiple Thread Dumps for Long-Running Threads
Comparing thread dumps across time reveals important performance patterns in your AEM instance. Start by establishing a baseline during normal operation, including peak usage periods and maintenance windows. This baseline provides context for identifying abnormal thread behaviour.
To determine if a thread is persistent across time:
- Select multiple thread dumps from different points in time.
- Click the Compare Threads button in IBM TDA.
- Look for threads that remain in the Runnable state across all dumps, especially those with consistently long stack traces.
\

\ Use IBM TDA’s Compare Threads feature to analyze dumps from different time points. Focus on threads that persist across multiple dumps, examining their states, stack depths, and resource usage. Remember that thread persistence alone doesn’t automatically indicate a problem — background services naturally run continuously, while request threads should complete within expected timeframes.
\ When analyzing persistent Runnable threads, correlate their behaviour with system metrics like CPU usage, memory consumption, and response times. Consider the thread’s purpose: background services, request processing, or maintenance tasks each have different expected patterns. For request threads, compare their duration against defined service level agreements and business requirements.
\ Got a suspicious thread pattern? Don’t jump to conclusions just yet! Try to recreate the issue in your test environment first — it’s like having a dress rehearsal before the main show. Take a good look at your code, double-check those config settings, and consider what else might be stirring up trouble in your environment. Keep track of what you find with real performance numbers and test results — you’ll thank yourself later.
\ Once you’re sure you’ve caught a real performance culprit (backed by solid evidence, of course), it’s time to fix it.
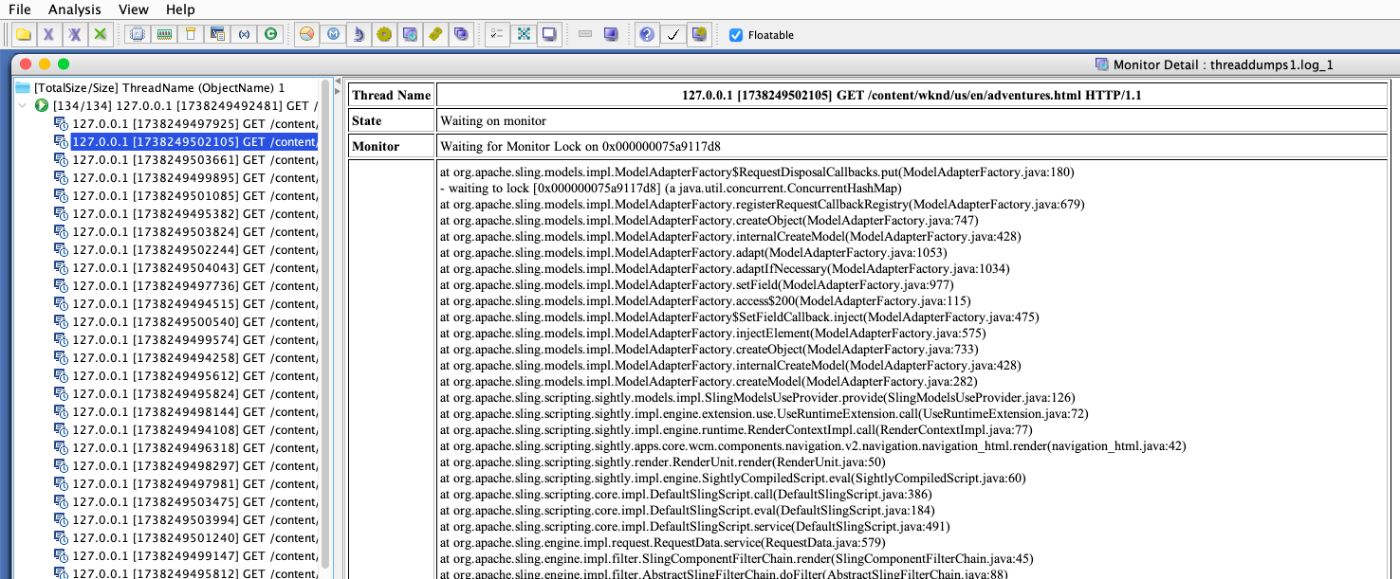
Step 10: Explore Monitor Details and Identify Idle Threads
If analyzing threads doesn’t yield actionable insights, switch to the Monitor Detail view:
Go back to the thread listing.
Select a thread dump and click the Monitor Detail button.
IBM TDA will display a tree view of monitor-owning threads and their waiting threads.

\ This view helps you identify threads that are holding monitors and causing contention. Understanding thread monitors is like viewing the nervous system of your application. These synchronization mechanisms control how threads access shared resources, preventing potential conflicts and ensuring smooth operation.
\ Monitor interactions can reveal critical performance insights. Some threads will be actively processing requests, while others wait for resource acquisition or participate in coordinated activities. Not all waiting or idle threads indicate a problem — they’re often part of the application’s natural resource management strategy.
\ However, not all threads are equally important:
- Ignore idle thread pool threads: These threads typically have ≤10 stack lines and are part of thread pools like the servlet engine. They’re usually harmless unless they dominate the thread pool.
- Focus on application-specific monitors: Look for monitors tied to your application’s business logic, such as database connections, caching mechanisms, or custom synchronization blocks.
\ Remember that thread and monitor analysis is both an art and a science. Each application has unique characteristics, so approach performance optimization with curiosity and a holistic perspective. The goal is not to eliminate all waiting threads but to understand and optimize their interactions.
\ Advanced Tip: If you notice certain monitors are frequently contended, consider refactoring your code to reduce lock granularity. For example:
- Replace coarse-grained locks with fine-grained ones.
- Use non-blocking algorithms or concurrent data structures where possible.
- Optimize database queries to reduce the time threads spend waiting for locks.
Bonus Insight: the Collector Service
In some thread dumps, you might notice the Collector Service appearing frequently. This service handles tasks like Garbage Collection, memory management, and resource cleanup. While the Collector Service might seem like a mysterious background process, understanding its behaviour is key to maintaining optimal system performance — think of it like a diligent janitor in a large office building.
\ When you notice frequent Collector Service activity, don’t immediately assume disaster. It’s normal for the Collector Service to show up occasionally, but excessive activity could indicate underlying issues:
- Memory leaks: Objects that are not being garbage collected can cause frequent GC cycles.
- High object churn: Rapid creation and destruction of objects can overwhelm the garbage collector.
- Improper JVM settings: Misconfigured heap sizes or GC algorithms can lead to inefficiencies.
\ Here are some considerations to optimize resource usage:
- Tuning your JVM settings (e.g., increasing heap size, switching to G1GC).
- Profiling memory usage with tools like Eclipse MAT or YourKit to identify leaks.
- Reviewing your application’s memory allocation patterns to reduce unnecessary object creation.
\ Garbage Collection is not a problem to be solved, but a dynamic system to be understood and optimized. Each application has unique characteristics, and there’s no universal solution.
Final Thoughts
Thread dump analysis is a developer’s superpower — transforming you from a code writer to a performance detective. IBM Thread Analyzer (TDA) is your key to understanding complex system behaviours, revealing hidden bottlenecks that impact your Java/AEM instance’s performance.
\ Like learning an instrument, your skill improves with practice. Each thread dump becomes clearer, revealing intricate patterns of system interactions. The more you analyze, the more intuitive performance optimization becomes.
\ Remember, practice makes perfect — the more you analyze thread dumps, the sharper your diagnostic skills will become. 📊💪
\ 🛠 ️Happy troubleshooting! And don’t forget to share your findings with your team to keep your Java/AEM instance running smoothly.
This content originally appeared on HackerNoon and was authored by Giuseppe Baglio
Giuseppe Baglio | Sciencx (2025-02-15T06:45:41+00:00) How to Expose (And Fix) Hidden Bottlenecks in Adobe Experience Manager. Retrieved from https://www.scien.cx/2025/02/15/how-to-expose-and-fix-hidden-bottlenecks-in-adobe-experience-manager/
Please log in to upload a file.
There are no updates yet.
Click the Upload button above to add an update.