
This content originally appeared on HackerNoon and was authored by Kitcast
\ In tech companies, data is often a raw material. You can think of it as an unrefined component. It gets its real value only when processed.
\ Without data, you're just guessing. But with the right data, you can optimize processes, improve decision-making, and create products that actually solve problems.
\ Raw data looks like massive arrays and endless numbers. Understanding it in this format may feel like trying to read a foreign language. To make sense of data, visualization comes into play. It turns any chunk of information into easy-to-digest content.
\ Several studies have proven that 90% of the information the brain consumes is visual. Our brains are wired to see and process images and videos faster than plain text.
\ If you need to derive actionable insights from massive datasets, apply these best practices for data visualization in tech companies.
What is data visualization and why does it matter?
Data visualization is still numbers, but easier to understand. Instead of viewing rows and rows of data, it can be turned into images: charts, graphs, maps, etc. To illustrate, a line graph showing a product's performance trends over time doesn’t just tell you whether things are going up or down. Numbers shown as visuals help you immediately spot patterns, outliers, or even potential issues before they snowball.
\ Among the options to visualize data are the following:
\
- Live Analytics/Interactive Data Dashboards - No matter the tech solution (digital signage, IoT, SaaS, etc.), dashboards provide instant insights into how a product or system performs. In short, you see how everything works in action.
- Business Intelligence (BI) Tools - BI tools can generate scheduled reports with key insights (Power BI, Tableau) provided as charts. They can also generate maps and heatmaps to visualize regional trends.
- 3D Data Visualization Spaces (IoT) - Interactive, three-dimensional digital environments where data from the Internet of Things is visualized in a spatial context.
- Augmented Reality (AR) & Virtual Reality (VR) - This tool displays complex data in immersive AR/VR environments. It’s useful for simulations and engineering.
- Digital Signage Systems - Imagine watching an endless data spreadsheet arranged into neat and clear visuals on standard screens. Digital displays are just for this. Digital signage software, like Kitcast, can pull information from web services and push it to screens in any visual format. Its real power is that it can display any of the above-mentioned tools’ data to screens as the final link in the visualization ecosystem.
Types of data that can be visualized in tech companies
Here are the main types of data that can exist within tech companies and be visually presented:
Product/Service Performance Data
- Usage Data: How often and how long users engage with a product or service. This could be data from software applications (e.g., active users, sessions, feature usage) or hardware (e.g., device uptime).
- Error Logs: Data capturing errors, crashes, and bugs within the product or service.
- Response Times: Metrics on how quickly systems, websites, or applications respond to user requests (e.g., server response times, load times).
- Availability/Uptime: Data that tracks the uptime and downtime of a service or product.
Customer Data
- Demographic Data: Information on who uses the tech company’s product or service (e.g., age, gender, location, job role).
- Engagement Metrics: How customers interact with the product, website, or service (e.g., click-through rates, time on site, product views).
- Customer Feedback: Data gathered from surveys, reviews, support tickets, or social media mentions about the product/service.
- Churn Rate: The percentage of customers who stop using the service/product over time.
Sales and Marketing Data
- Lead Generation and Conversion Rates: Data on how many leads are generated and how many convert into paying customers.
- Customer Acquisition Cost (CAC): The cost associated with bringing in more customers. It typically includes marketing and sales efforts.
- Return on Investment (ROI): Metrics that evaluate the effectiveness of marketing campaigns or sales strategies.
- Revenue Metrics: Data such as total revenue, revenue per customer, recurring vs. one-time payments, etc.
- Customer Lifetime Value (CLV): The total revenue a customer brings in throughout the relationship with the company.
Operational Data
- Server Logs: Data generated by servers, detailing usage, errors, requests, etc.
- System Resource Usage: Data related to the consumption of resources such as CPU, memory, disk space, and bandwidth by internal systems, servers, or devices.
- Supply Chain Data: For tech companies dealing with physical products (like hardware or IoT), data related to the movement of goods, inventory levels, and supplier performance.
- Security Logs: Data capturing access attempts, security incidents, vulnerabilities, and breaches within systems or networks.
Development Data (DevOps and Software Development)
Version Control Data: Information about code changes, commits, branches, and merge histories stored in version control systems (like Git).
CI/CD Pipeline Metrics: Data on the performance of Continuous Integration/Continuous Delivery pipelines, including build success rates, deployment times, and code quality metrics.
Test Coverage and Bug Tracking: Data from automated testing and manual bug reports, showing the quality and stability of software.
Code Quality Metrics: Data such as cyclomatic complexity, code duplication, or bug density to assess the maintainability and health of codebases.
Business Intelligence (BI) Data
- Market Trends and Competitive Analysis: Data related to market conditions, industry trends, and competitor performance.
- Customer Insights: Data derived from customer behavior, demographic studies, and market research.
API Data
API Usage Metrics: Information about how often APIs are called, error rates, response times, and data throughput.
Integration Data: Data on how various software systems interact and integrate via APIs.
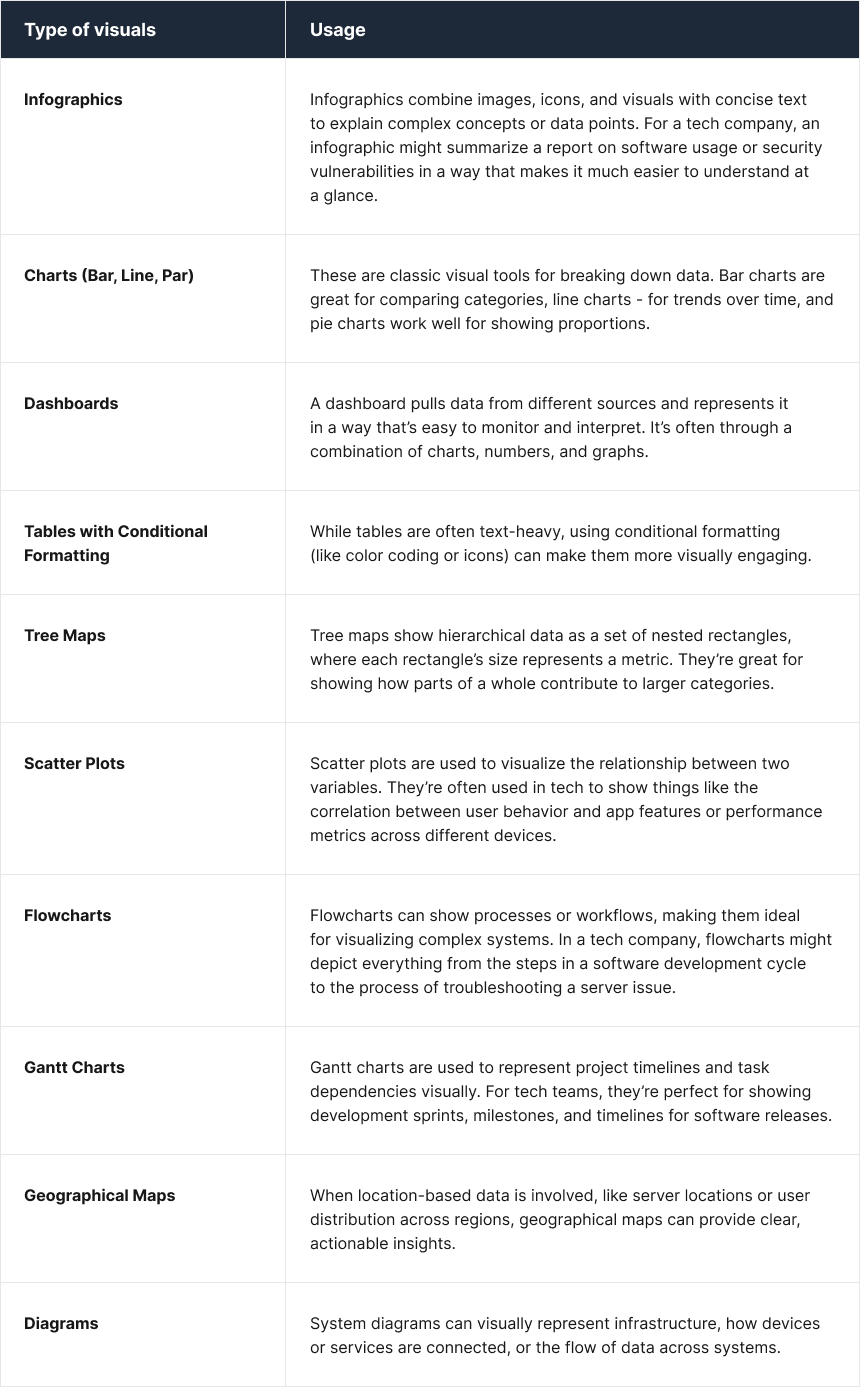
Types of content to use to display data effectively
Visualization turns into something functional when it stops being just a catchy image and becomes a “clarity catalyst”. What’s more, companies can take these visuals and push them to solutions like digital signage to give them visibility across the office, the bunch of offices, or wherever it’s needed.
\ In this case, the data aren’t only well-arranged but also efficiently displayed. Instead of only a few people who are highly interested in the data and make the effort to log into online platforms to view it, digital signage puts it front and center. You can even turn a TV into digital signage and show the data on big screens that grab everyone’s attention.
\ Let’s explore the different ways tech companies can transform raw data into meaningful insights.
\
Key benefits of data visualization for tech companies
The key difference between the tech companies that thrive and those that fall behind is how they use the greatest asset - data. Without making sense of it all, businesses run the risk of arriving at decisions that are either outdated or just flat-out wrong.
\ Here are the benefits of interpreting abstract data into visualized, actionable information.
\
- Data-Driven Decision-Making
Data-driven decision-making is the backbone of staying competitive. It’s about extracting insights and grasping the big picture for making key business moves.
\ Netflix is a good example of data visualization for decisions. They answer all kinds of important questions based on data: how to make the experience better, which shows and films are the most preferred, or who they could partner with to expand into new markets. According to Netflix TechBlog, they have Analytics and Visualization Engineers who work on data sets and create visualizations and dashboards.
\
- Real-Time Insights
In tech, you don’t have the luxury of waiting around for answers to come their way. Real-time insights are what indeed keeps businesses afloat. Data visualized and instantly delivered, for instance, on screens scattered across strategic departments, saves companies from lost revenues. Teams get “here & now” access to live performance metrics or alerts, so they can start responding to them as soon as possible.
\
- Identifying Trends
Spotting trends is like having a roadmap with areas where to invest, what products to develop, and markets to enter. When businesses stay on top of what’s hot and what’s not, they get ahead of the curve. They offer what customers start to crave before they even realize it themselves.
\ It’s also about simply staying relevant, thus staying competitive. Trends reflect what consumers need or may want. This helps tech companies meet those demands head-on.
\
- Improved Customer Understanding
Companies that prioritize customer focus, along with improving operations and IT can boost their profits by 20-50 % of their costs (McKinsey). Customer understanding starts with the data-first philosophy. Businesses relying on gut feeling may win in some situations, but strong performers are only those who get customer data, process it, and act based on it.
\ One of the best examples here is how Foursquare uses data visualization for their clients’ business goals. They turn geospatial data into impactful visuals showing maps with annual sunshine duration, solar suitability areas, flights, etc.
\
Is your strategy up to par?
What makes data visualization a competitive advantage is the speed at which insight becomes an action. For tech companies, time is often the biggest factor separating leaders from laggards. If a company can take large datasets from multiple sources (user behavior, system performance, sales analytics, etc.) and translate them into a visual format, it becomes significantly easier to make decisions. With platforms like Kitcast, data is displayed on digital signage in real time, giving your team the edge to act quickly. It's all about being proactive, not reactive.
\ Data is only as powerful as your ability to use it.
\ Is your data sitting still in spreadsheets as numbers or working for you?
\
This content originally appeared on HackerNoon and was authored by Kitcast
Kitcast | Sciencx (2025-02-26T15:16:05+00:00) The Power of Data Visualization for Tech Companies. Is Your Strategy Up to Par?. Retrieved from https://www.scien.cx/2025/02/26/the-power-of-data-visualization-for-tech-companies-is-your-strategy-up-to-par/
Please log in to upload a file.
There are no updates yet.
Click the Upload button above to add an update.