This content originally appeared on TimKadlec.com on Web Performance Consulting | TimKadlec.com and was authored by TimKadlec.com on Web Performance Consulting | TimKadlec.com
One thing that jumped out while working on the JavaScript chapter of the Web Almanac was the incredibly high amount of time spent processing JavaScript on the median mobile page where Ember.js was detected. (The story was the same when I wrote The Cost of JS Frameworks.)
What we found was that the median site using Ember.js spent 21.9s dealing with JavaScript when loaded on an emulated mobile device. That’s a whopping 14.4s longer than the next closest detected library or framework.
It would be one thing to see a number like that late in the long-tail; if, for example, we saw that at the 99th percentile it would represent an anomaly where something probably went very wrong. But to see it at the median is really startling.
I wanted to follow-up, to satisfy my own curiosity, but honestly forgot about it during all the holiday season shuffling until someone asked about it on Twitter.
So, let’s dig in and see what the heck is going on.
First things first, I ran a query against BigQuery to return all of the sites that perform worse than the median. There were a lot of pages that were subdomains at Fandom.com, so I ran another query and it turns out a whopping 99% of all URLs performing worse than the median were Fandom sites.
Running against the December data (the latest run at the time of digging in) confirmed the same situation was still in place.
In the December run of HTTP Archive, Ember was detected on 17,733 URLs. Of those, 13,388 (75%) are subdomains at fandom.com. And, again, those subdomains comprise the bulk of the poor performers.
It’s worth noting: this is only true on mobile. Fandom sites serve different versions of the site to mobile browsers. The desktop version doesn’t use Ember; the mobile version does. That’s why, if we query desktop sites in the December run of HTTP Archive, we only see 4,869 sites using Ember compared to 17,733 mobile sites.
Now that we know Fandom sites are particularly common, and problematic, we can compare the aggregate processing times for all pages with Ember detected to A) all Fandom pages with Ember detected and B) all pages with Ember detected that aren’t Fandom pages.
| URL Subset | 10th | 25th | 50th | 75th | 90th |
|---|---|---|---|---|---|
| All Ember URLs | 3516.5ms | 11474.9ms | 19064ms | 25782.6ms | 32636.8ms |
| Fandom Sites | 14867.9ms | 17515.1ms | 21790.8ms | 28172.8ms | 34309.9ms |
| Fandom Sites Excluded | 2111.5ms | 2985.1ms | 3968.3ms | 5741.4ms | 8362.9ms |
So, this left me with a few follow-up questions.
How does HTTP Archive figure out which URLs to track?
First off, where does HTTP Archive get their list of URLs? That laundry list of *.fandom.com sites seems suspicious.
I pinged Rick Viscomi and Paul Calvano and it turns out that HTTP Archive generates its list of URLs by querying the most recent month’s Chrome User Experience Report (CrUX) data. Given the timing, there’s essentially a two-month gap between CrUX data and HTTP Archive URLs. In other words, December’s HTTP Archive run would use the URLs found in October’s Chrome User Experience Report.
Whether a site shows up in CrUX is up to the traffic level—sites with enough traffic during any given month are reported, sites without enough traffic during the month are not. So the bias in URLs here comes from reality—subdomains at Fandom.com really do comprise the majority of popular Ember use (that we can detect).
Since Ember’s overall sample size is relatively small (contrast that 17,333 URLs with Ember to the 337,737 URLs with React detected, for example) one popular use of the library is enough to significantly mess with the results.
Ok. So why do these sites perform so poorly?
Which brings us to question #2: what the heck are those sites doing that is so bad?
I tested https://voice-us.fandom.com/, the median site for the run the Web Almanac was based on, using a combination of WebPageTest (you can check out the full results, if you’re keen), using a Moto G4 over a 3G network, and Chrome Dev Tools with a 4x CPU throttle (When I could. I’d estimate dev tools froze maybe 80% of the time when trying to load the profile.)
The results weren’t pretty.
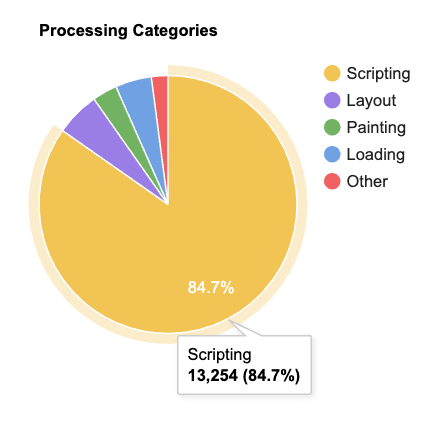
The WebPageTest run shows 13,254ms of script related work during the initial page load.

WebPageTest’s processing breakdown shows that JavaScript related work accounted for 13,254ms, or 84.7% of all work during the page load.
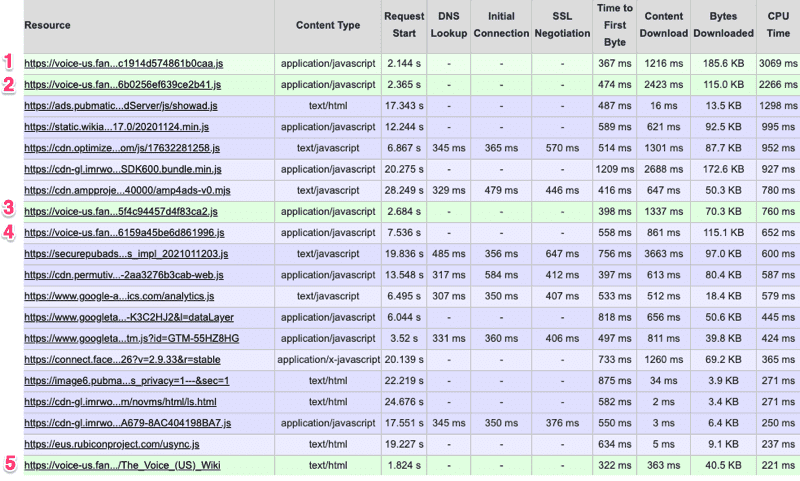
WebPageTest also shows us the total CPU time associated with each request. If we sort that by CPU time, we’ll see that while there are plenty of third-party scripts also costing us precious CPU time, the top two offenders are first party scripts, and five of the top 20 offenders. Between the five scripts, we have 6,968ms of CPU activity.

Looking at the request details in WebPageTest, and sorting by CPU Time, shows that first-party scripts make up five of the top 20 offenders.
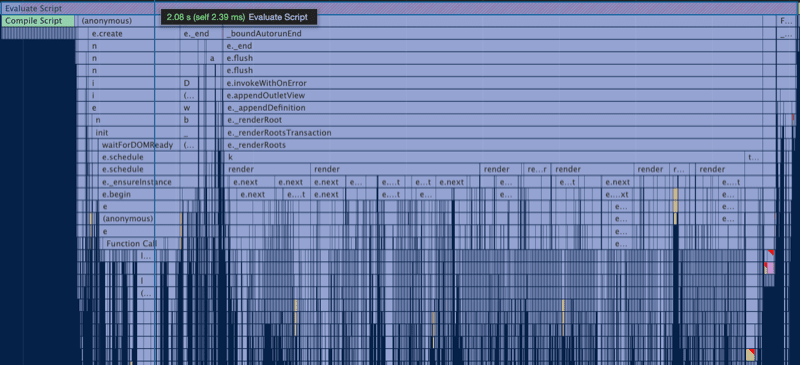
The most significant long task is the initial execution of the mobile-wiki script, which on this test resulted in a 2s long task.

Digging into the performance timeline shows a massive 2s long task early on as Ember gets the app ready to go.
I’m far from an Ember expert, so I talked to Melanie Sumner and Kris Selden from the Ember JS Core Framework Team to help me better understand what was going on in those massive long tasks. Turns out, there a few different things that are all working together to create the perfect environment for poor performance.
First up, the Fandom sites use server-side rendering but rehydration appears to be failing here, if it’s used at all.
For rehydration to work, the client rendered DOM must match what was served via the server. When Ember boots up on the client, it’s going to compare the existing DOM structure with the DOM structure the client-side app generates—if that DOM structure is mismatched (the HTML provided by the server is invalid, third-party scripts alter the DOM before hydration occurs, etc) the rehydration process breaks. This is massively expensive as now the DOM has to be tossed out and rebuilt.
The second major issue here that Kris pointed out was that all the work triggered by _boundAutorunEnd in the flame chart, as well as the forced layouts and style recalculation, indicates that the app is relying heavily on component hooks and/or computed properties. This is a frequent issue seen in Ember apps, often leading to multiple render passes which, as you might expect, can get very expensive. With the new Glimmer component, Ember greatly reduced the number of lifecycle hooks (to just two) to help avoid this issue altogether.
Finally, there’s just a lot of code involved in initializing the app. It’s likely that much of what is being built here doesn’t even need to be in that initial rendering process. Trying to do too much during the initial render phase is a very common issue with any site built with a single-page-architecture. The more we can lazy-load individual components to break up that initial render cost, the better.
So…..what about Ember?
To me, there are a couple of things worth noting about this whole thing.
First, it’s a cautionary tale about not digging deep enough into data. We had an outlier—not in terms of comparing Ember to Ember, but Ember to other frameworks—which is always something worth exploring.
Looking closer paints a different picture than we originally saw. It’s not that Ember itself is so much worse on mobile than other frameworks (in fact, if we exclude this one example, the numbers for Ember look pretty good when compared with many of its counterparts). Instead the results are exaggerated by a combination of the sample size being relatively small compared to more popular choices and that sample set being dominated by one particularly egregious example.
While we’ve seen that Ember’s results are not as bad as they seem at first blush, what this example also shows us is how easy it is for things to get out of hand
Digging deeper into the troublesome examples reveals a few patterns folks should look to avoid when using Ember for their own projects. Though, honestly, the patterns here aren’t specific to Ember: too much work during initialization, broken rehydration, forced layouts and style recalculation—these are all common issues found in many sites that rely on a lot of client-side JavaScript, regardless of the framework in use.
This content originally appeared on TimKadlec.com on Web Performance Consulting | TimKadlec.com and was authored by TimKadlec.com on Web Performance Consulting | TimKadlec.com
TimKadlec.com on Web Performance Consulting | TimKadlec.com | Sciencx (2021-01-26T15:29:55+00:00) What About Ember?. Retrieved from https://www.scien.cx/2021/01/26/what-about-ember/
Please log in to upload a file.
There are no updates yet.
Click the Upload button above to add an update.
