
This content originally appeared on Level Up Coding - Medium and was authored by Maksym Mostovyi

Implementing 3D Charts In Angular Application
There are several libraries that can help us in creating 3D charts, such as Plotly.js, ZingChart, also we can use Three.js or a combination of d3 and x3dom libraries, but it is going to be a bit complicated. Here I would like to show how to make 3D charts in Angular applications quick and easy. I am going to highlight the implementation of pie and bar charts.
For that purpose, my pick is highchart.js. It allows building charts like line, bar, pie, scatter, bubble, and most important for our case it supports 3D charts.
To get started, first we need to create an angular app by using the following command.
ng new graphs
Now we can install the highchart library and by the way, it is worth mentioning that it has an official wrapper for Angular and we need to install it too.
npm install highcharts --save
npm install highcharts-angular --save
Once it is installed we need to import the library module to app.module.ts
I decided to split my pie and bar charts into different components. So, let’s start with the implementation. But before that, we should not forget to import the charts library to our component.
Here is how the chart looks like:
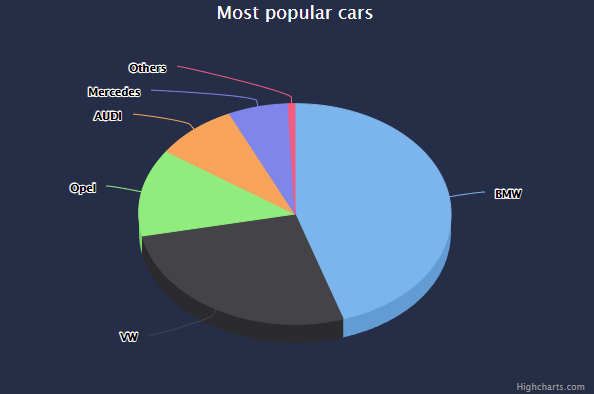
As you can see it’s quite easy to implement such a chart. We just need to set up the configurational object and pass it to the library component.
Let’s overview some parts of the config object. One of the important parts in it is options3d, there we define the next things:
enabled: enables 3D functionality;
alpha: one of the two rotation angles for the chart;
beta: one of the two rotation angles for the chart.
The rest part of the code is quite simple and self-explanatory. Let’s take a look now at bar chart implementation.
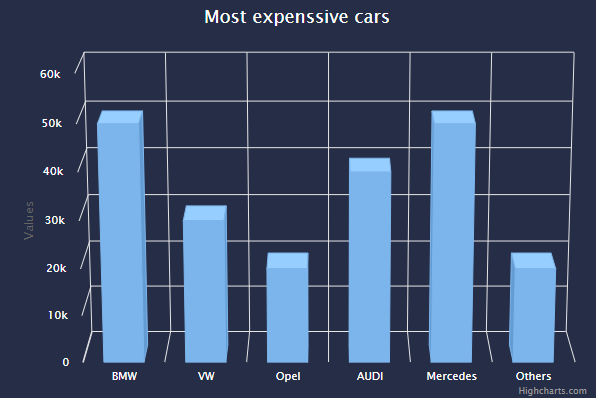
As you can see it is a bit similar to a pie chart. In the bar chart, we should mention extra options for options3d.
depth : the total depth of the chart;
viewDistance: defines the distance the viewer is standing in front of the chart, this setting is important to calculate the perspective effect in column and scatter charts. It is not used for 3D pie charts;
Summary
Both charts did not take that much time to implement it is very easy to configure them in the way you like. Besides, the types of charts that I mentioned above, you can take a look at the rest available once, like stacking or scatter charts. You can find them among highcharts demos. Also, you can try to improve the charts I made yourself, by adding functionality that will rotate the chart on mouse move. It can be done by changing dynamically values inside options3d. The source code of charts you can find in my Github.
That is it. Hope it was helpful.
Implementing 3D Charts In Angular Application. was originally published in Level Up Coding on Medium, where people are continuing the conversation by highlighting and responding to this story.
This content originally appeared on Level Up Coding - Medium and was authored by Maksym Mostovyi
Maksym Mostovyi | Sciencx (2021-11-10T17:03:15+00:00) Implementing 3D Charts In Angular Application.. Retrieved from https://www.scien.cx/2021/11/10/implementing-3d-charts-in-angular-application/
Please log in to upload a file.
There are no updates yet.
Click the Upload button above to add an update.