This content originally appeared on Bits and Pieces - Medium and was authored by Tomoe Li

In this article I’ll summarize a few Chrome DevTools debugging tips that have been useful in my work. These have helped me solve a lot of minor problems during the development phase.
Console
Personally, I like to categorize different console messages, and luckily, Chrome DevTools has this feature!
This is what it looked like before:
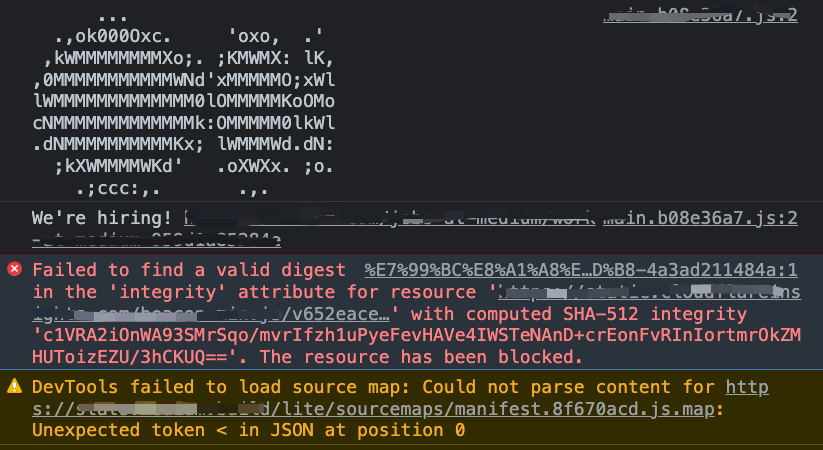
Alright, There are info, error, and warning, if there is more information in the development environment, it will also affect the key information we want to find.
So, let’s clean it!
- Open the Console
- Click on the red frame in the picture.
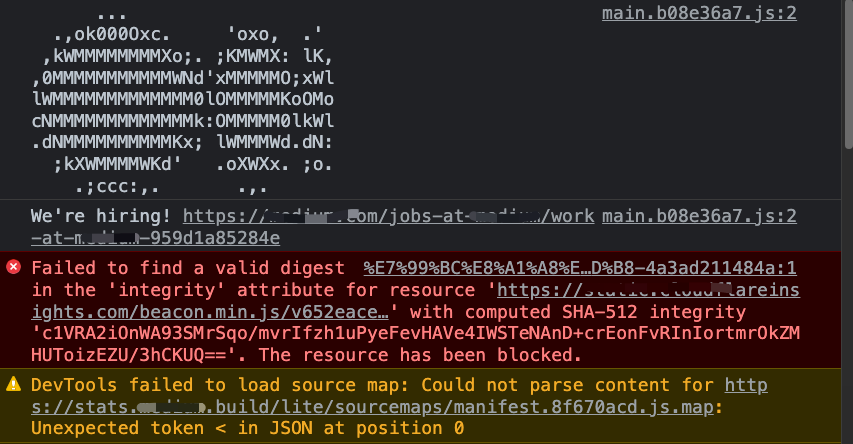
3. Then, this sidebar will appear. This shows us each console message by category.

Filters
There are two ‘Filter’ features, both of which are very useful. The first is in the input box of the Console option.

Let’s try typing a “-test” character into the input box and see what happens in the Console(Let’s now print a piece of code in the console that console.log('test a log'))
On the left is the message of the normal log without the input in the Filter input box, and on the right is the image where we entered “-test”
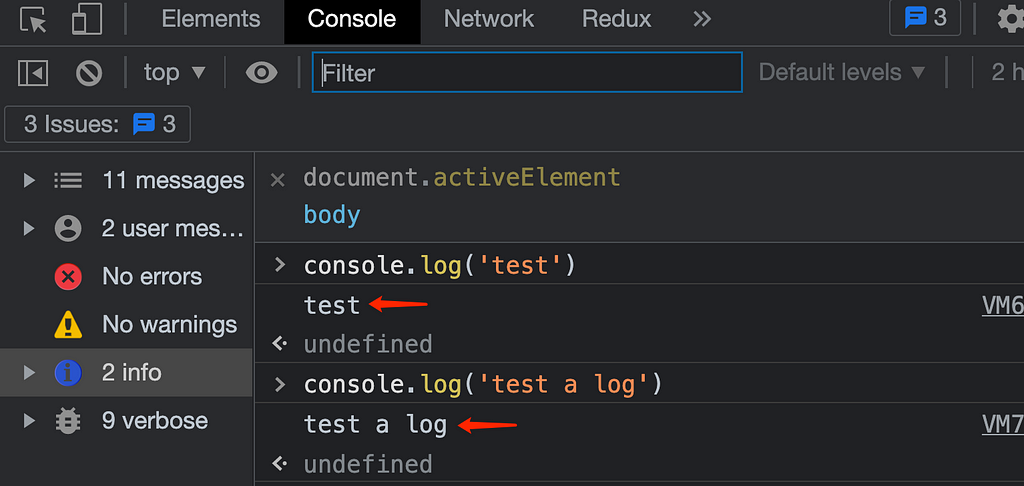
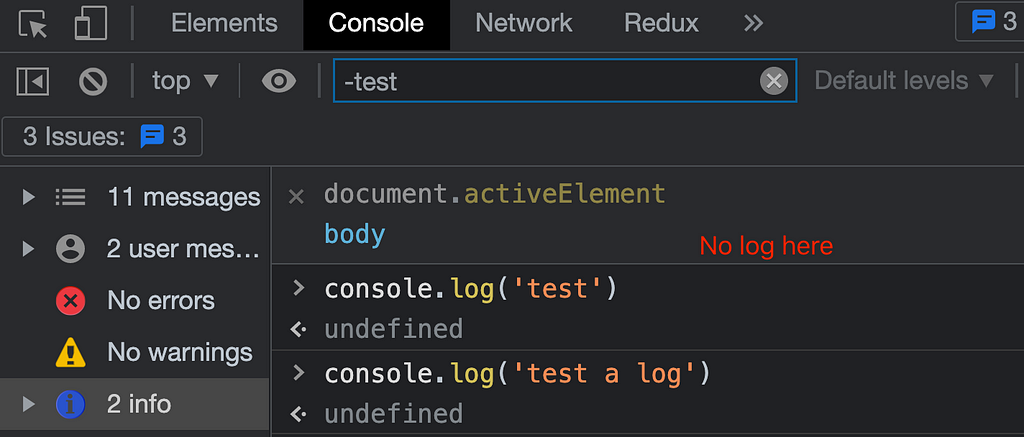
This has helped us filter the log messages for “test”.
It can also achieve the same effect on the above, but NetWork is more feature.
For example, it can filter many resource types, such as Fetch/XHR, JS, CSS, Img, etc.

Create Live Expression
This is a very interesting and useful feature, I’m using it every day.
If you find yourself typing the same JavaScript expression in the Console repeatedly, you might find it easier to create a Live Expression. With Live Expressions you type an expression once and then pin it to the top of your Console. The value of the expression updates in near real-time(reference from Chrome).
Let’s create a live expression.
- Open the Console;
- Click Create Live Expression. The Live Expression text box appears.

3. Try inputing document.activeElement Then type Control+Enter or Command+Enter (Mac) to save the expression, or click outside of the Live Expression text box.
4. Try clicking on any area of the page and notice the change on the right side, it will show the tag name and class name of the element we clicked on in real time.
I’ve added another option that will show the title of the current page:

Conclusion
This article has written a few very useful Chrome DevTools features, I hope it can help you in your work, of course, it has more rich features, follow me, I will continue to update!
Thank you for taking the time to read this article! What tips and tricks do you use? Be sure to let us know in the comments!
Build component-driven. It’s better, faster, and more scalable.
Forget about monolithic apps, start building component-driven software. Build better software from independent components and compose them into infinite features and apps.
OSS Tools like Bit offer a great developer experience for building component-driven. Start small and scale with many apps, design systems or even Micro Frontends. Give it a try →
Chrome DevTools Tips and Tricks for Programmers was originally published in Bits and Pieces on Medium, where people are continuing the conversation by highlighting and responding to this story.
This content originally appeared on Bits and Pieces - Medium and was authored by Tomoe Li
Tomoe Li | Sciencx (2022-02-01T20:56:58+00:00) Chrome DevTools Tips and Tricks for Programmers. Retrieved from https://www.scien.cx/2022/02/01/chrome-devtools-tips-and-tricks-for-programmers/
Please log in to upload a file.
There are no updates yet.
Click the Upload button above to add an update.
