This content originally appeared on Bits and Pieces - Medium and was authored by Suman
Production Debugging in Chrome | Minified JS | Blocker defects debugging in Production.

Are you frustrated with production defects? I can understand your pain if something working in your local but got suddenly broken in production or any upper-level environment. You keep trying but are not able to reproduce, your manager is behind you, your clients keep calling you — so many escalations as real users getting impacted. Everyone is waiting for your fixes but you don’t know how to debug in production.
I can still remember one weekend I was enjoying myself with my girlfriend, suddenly got a call from my manager saying the application was not working in production, fix this ASAP. There was no one available that day, no one from DB, backend, even my manager wasn’t available. Clients are directly calling to me, no one was there to help.
Can you imagine the situation? If you are in the JavaScript world, you are lucky, we can debug the minified JavaScript code directly from Chrome itself.
We can reproduce the same error in a test environment with an un-minified JavaScript version that doesn’t work out.
Everything has advanced, even browsers have advanced, understood the developer’s problem, and provided an unpaid feature called Pretty-Print. If you are smart you can use this feature.
Have a look at the below steps to debug
- Open your application in the browser.
- Now press F12 or Ctrl + Shift + I or right-click anywhere inside the web page and select Inspect, mostly the last option.
- Then click on the source tab in the developer tool and find the minified main.js file, click on that.
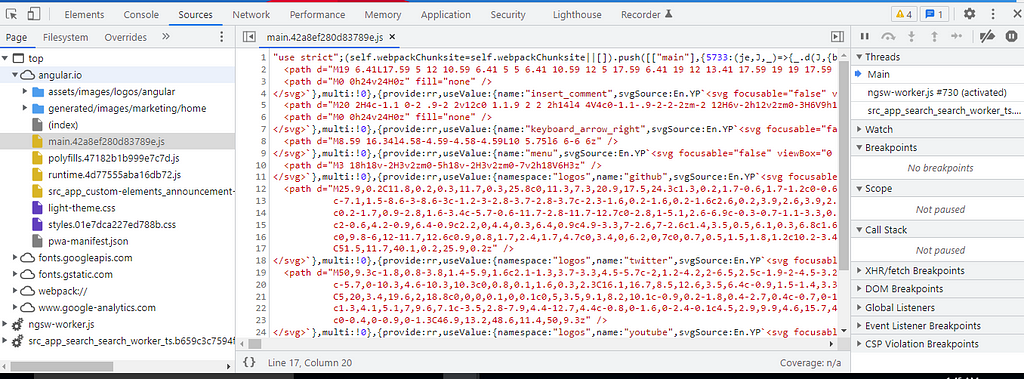
4. After that you will see the {} option on the left corner that is called pretty-print.
Check the below image to find it:
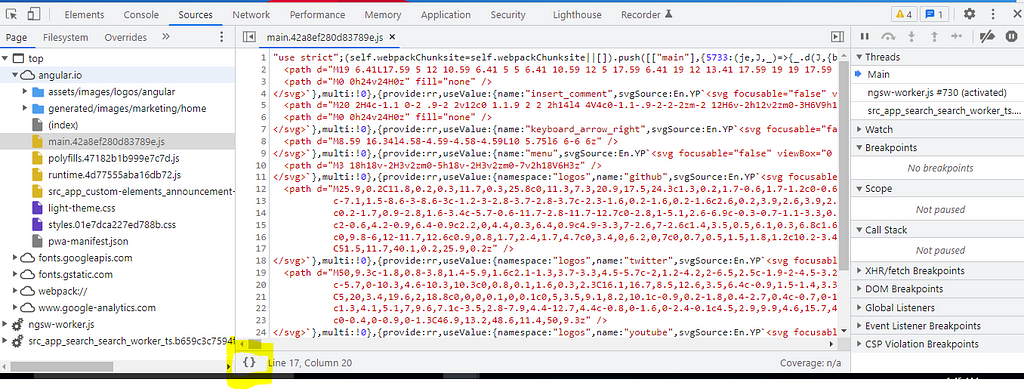
5. Click on that {} sign, you will get a new tab with formatted source code in JS.
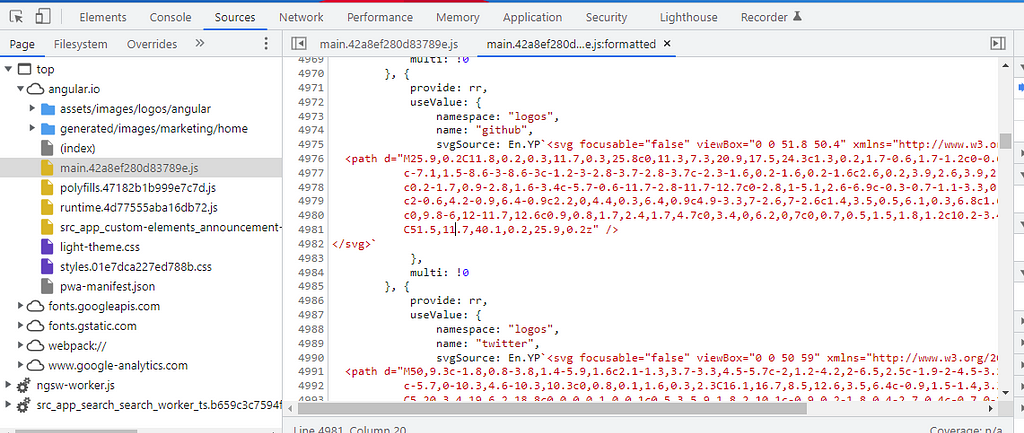
6. Now you can see the line number on the left side, anywhere you can click on the line number to put the debugger where ever you need.
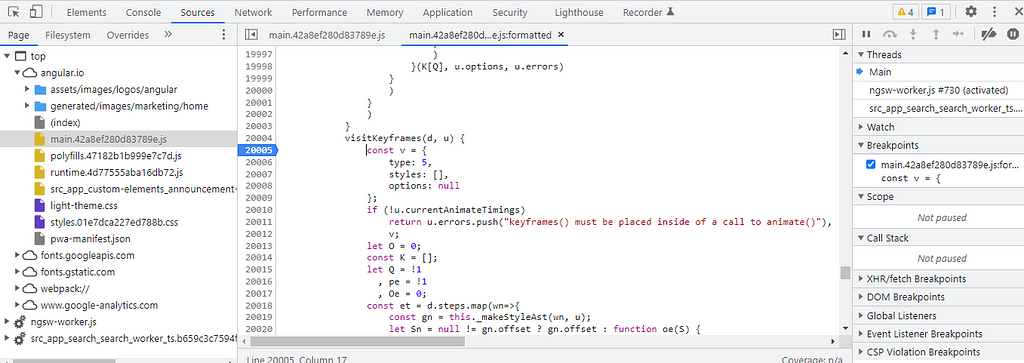
7. Now refresh the page by clicking the browser refresh button. Please do not press F5 as this will refresh the developer tool and wait for the breakpoint to hit.
8. Once the breakpoint is hit, again click on { }, you will see a new tab with breakpoint maintained at the same place.
9. Now you can see values and you can debug easily.
That’s all. I hope this article helps you to reduce your production defects.
Please follow me if you like the article and do check my coding blog https://coderfact.com/
Unlock 10x development with independent components
Building monolithic apps means all your code is internal and is not useful anywhere else. It just serves this one project. And as you scale to more code and people, development becomes slow and painful as everyone works in one codebase and on the same version.
But what if you build independent components first, and then use them to build any number of projects? You could accelerate and scale modern development 10x.
OSS Tools like Bit offer a powerful developer experience for building independent components and composing modular applications. Many teams start by building their Design Systems or Micro Frontends, through independent components. Give it a try →
A Tip That Helped Me Debug JavaScript Code in Production was originally published in Bits and Pieces on Medium, where people are continuing the conversation by highlighting and responding to this story.
This content originally appeared on Bits and Pieces - Medium and was authored by Suman
Suman | Sciencx (2022-02-15T10:34:04+00:00) A Tip That Helped Me Debug JavaScript Code in Production. Retrieved from https://www.scien.cx/2022/02/15/a-tip-that-helped-me-debug-javascript-code-in-production/
Please log in to upload a file.
There are no updates yet.
Click the Upload button above to add an update.
