This content originally appeared on / and was authored by antoinevastel.com
TL;DR
In this blog post, we use Git-Python and Matplotlib to explore the Avastel all infected IPs 7d blocklist. The main findings are the following:
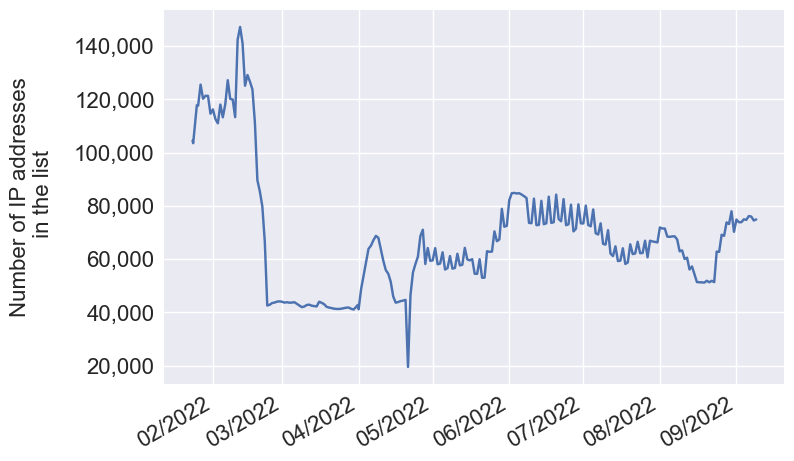
- There are ~70K distinct IP addresses in the list at a given time;
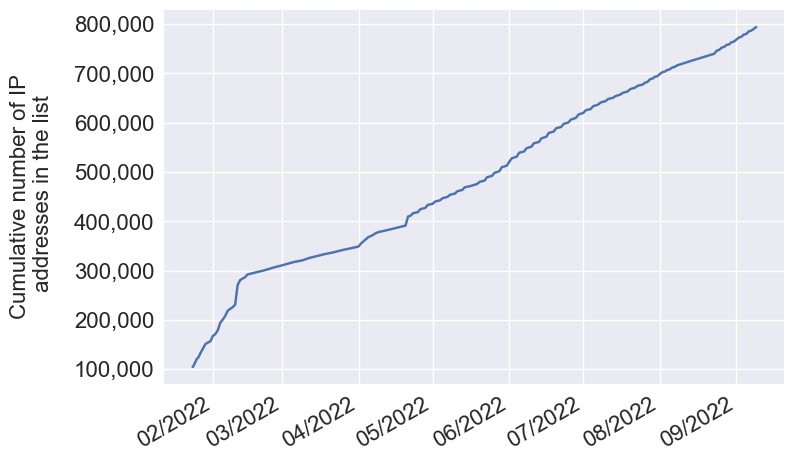
- 800,000 malicious IP addresses have been flagged in 8 months;
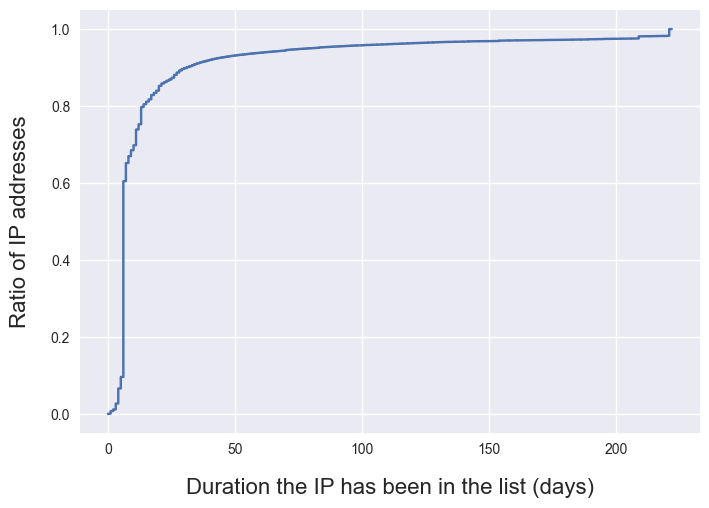
- 10.3% of the IPs have been included in the list for > 1 month;
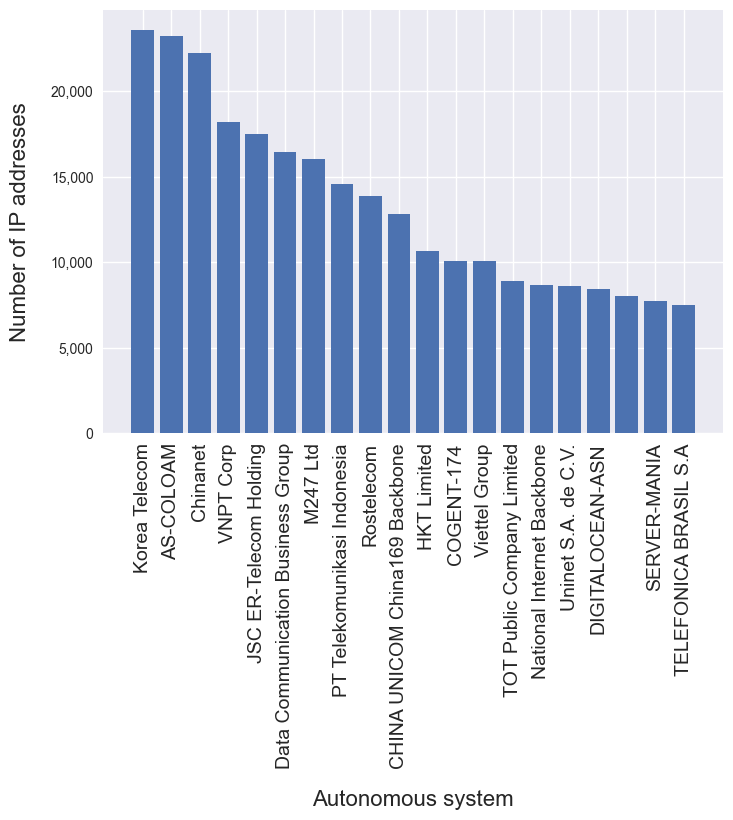
- The top 3 autonomous systems whose IP addresses are the most frequently flagged as proxies or used by bots are 1) Korea Telecom, 2) AS Coloam and 3) Chinanet;
- We also observe a long tail of data-center and residential autonomous systems from which we originate a significant volume of malicious traffic, such as M247 Ltd, HKT Limited, and Telefonica Brasil.
The purpose of this blog post is two-fold:
- Provide insights on the Avastel all infected IPs 7d blocklist. For example, we want to visualize the number of malicious IPs over time, study how long IPs tend to stay in the list, as well as identify the top autonomous systems included in the list;
- Show you how you can automate this kind of analysis in Python using Git-python and Matplotlib.
If you’re more interested in the latter, you can jump directly to the last section of the blog post.
Feel free to read this other blog post if you want to learn more about the different IP blocklists I maintain.
Collect metrics automatically using Git-python
First, we create an analysis.py file that contains our Python code used to explore the IP blocklist.
touch analysis.py
In the same directory, we clone the avastel-bot-ips-lists repository
git clone https://github.com/antoinevastel/avastel-bot-ips-lists.git
You should have the following directory structure:
analysis.py
avastel-bot-ips-lists/
The first step of our analysis is to import git-python and create a repository object that points to the avastel-bot-ips-lists repository. Then, we can list all commits to iterate on them later and see the state of the list for each commit.
from git import Repo
from dateutil import parser

repo = Repo('./avastel-bot-ips-lists')
commits = list(repo.iter_commits('master'))
Then, we iterate on all commits, and for each of them we extract a few metrics, such as:
- The date of the list;
- The IPs present in the list;
- To which autonomous system IP addresses belong to;
- The cumulative number of IPs present in the list at a given date.
# A few variables to store metrics about the IP list:
ip_to_dates = dict()
ip_to_as = dict()
num_ips_list_stat = []
cum_num_ips_stat = []
ips_seen = set()

try:
    # We iterate on each commit in chronological order
    for idx, commit in enumerate(reversed(commits)):
        print(f'{idx} - Commit: {commit}')
        repo.git.checkout(commit)
        try:
            with open('./avastel-bot-ips-lists/avastel-ips-7d.txt', 'r') as block_list:
                # We parse the file header to extract information about the date
                block_list.readline()
                header_date_list = block_list.readline()
                date_str = header_date_list.replace('# Last update: ', '').replace(' (Coordinated Universal Time)', '')
                date_parsed = parser.parse(date_str)

                header_num_ips_blocked = block_list.readline().split(': ')[1].replace('\n', '')
                num_ips_list_stat.append((date_parsed, int(header_num_ips_blocked)))
                block_list.readline()
                block_list.readline()

                for line in block_list:
                    ip_address, autonomous_system = line.replace('\n', '').split(';')
                    ips_seen.add(ip_address)
                    if ip_address not in ip_to_dates:
                        ip_to_dates[ip_address] = []
                        ip_to_as[ip_address] = autonomous_system

                    ip_to_dates[ip_address].append(date_parsed)

                cum_num_ips_stat.append((date_parsed, len(ips_seen)))
        except FileNotFoundError:
            # Can happen for the first commits of the repo since the avastel-ips-7d list didn't exist yet
            print('No file')
except Exception as e:
    print(e)
finally:
    # Checkout to master to leave the list repo in a "stable" state no matter what happens
    repo.git.checkout('master')
Then, for each IP address, we compute how long it stayed in the list.
duration_presence_list_ips = []
ip_to_time_in_list = dict()
for ip_address, dates in ip_to_dates.items():
    if len(dates) > 1:
        dates_deduplicate = set([str(d.date()) for d in dates])
        dates.sort()
        duration_presence_list_ips.append(len(dates_deduplicate) - 1)
        ip_to_time_in_list[ip_address] = len(dates_deduplicate) - 1
We also compute the number of distinct IP addresses in the list per autonomous system to make statistics about autonomous systems frequently linked to proxies and bot IPs.
autonomous_system_to_num_ips = dict()
for ip_address in ips_seen:
    if ip_to_as[ip_address] not in autonomous_system_to_num_ips:
        autonomous_system_to_num_ips[ip_to_as[ip_address]] = 0

    autonomous_system_to_num_ips[ip_to_as[ip_address]] += 1
Visualize IP address metrics using Matplotlib (Python)
Now that we computed several metrics related to IP addresses and autonomous systems, we can do some data visualization using Matplotlib. First, we import Matplotlib and define some constants to generate consistent graphs.
import matplotlib.pyplot as plt
import matplotlib.dates as mdates

# To have better-looking graphs
plt.style.use('seaborn')

font_size_label = 16
font_size_ticks = 16
font_size_legend = 13
pad_xlabel = 15
pad_ylabel = 15
Then, we define three functions to visualize our data.
The first function, plot_time_series takes as input a list of (x, y) tuples representing the data of the time series we want to plot and generate a graph based on it.
It also takes as input a y_label parameter to customize the y-axis.
def plot_time_series(graph_xy_data, y_label, output_path):
    _, ax1 = plt.subplots()

    ax1.set_ylabel(y_label, fontsize=font_size_label, labelpad=pad_xlabel)
    ax1.plot([x[0] for x in graph_xy_data],
                        [x[1] for x in graph_xy_data])

    ax1.xaxis.set_major_formatter(mdates.DateFormatter('%m/%Y'))
    ax1.tick_params(axis='both', which='major', labelsize=font_size_ticks)

    ax1.get_yaxis().set_major_formatter(plt.FuncFormatter(lambda x, loc: "{:,}".format(int(x))))

    plt.gcf().autofmt_xdate()
    plt.savefig(output_path, bbox_inches='tight')
    plt.close()
The second function, plot_cdf_duration_ips_list , generates a CDF (cumulative distribution function) graph based on an input list that contains numbers (here, the time an IP has been in the blocklist).
Using a CDF graph enables us to better understand the distribution of the data.
def plot_cdf_duration_ips_list(duration_presence_list_ips):
    x = np.sort(duration_presence_list_ips)
    y = 1. * np.arange(len(duration_presence_list_ips)) / (len(duration_presence_list_ips) - 1)

    _, ax1 = plt.subplots()

    ax1.set_ylabel('Ratio of IP addresses', fontsize=font_size_label, labelpad=pad_xlabel)
    ax1.set_xlabel('Duration the IP has been in the list (days)', fontsize=font_size_label, labelpad=pad_xlabel)

    ax1.plot(x, y)

    plt.savefig('./results/cdf_duration_presence_list.png', bbox_inches='tight')
    plt.close()
The third function, plot_top_autonomous_systems, generates a bar chart that represents the number of IP addresses flagged as malicious per autonomous system.
You can also configure the number of autonomous systems you want to display on the graph.
def plot_top_autonomous_systems(autonomous_system_to_num_ips, num_ases=10):
    sorted_autonomous_system_to_num_ips = sorted(autonomous_system_to_num_ips.items(), key=lambda item: item[1], reverse=True)
    x_pos = np.arange(num_ases)

    plt.bar(x_pos, [x[1] for x in sorted_autonomous_system_to_num_ips[:num_ases]])
    plt.xticks(x_pos, [x[0] for x in sorted_autonomous_system_to_num_ips[:num_ases]], fontsize=font_size_ticks)
    plt.ylabel('Number of IP addresses', fontsize=font_size_label, labelpad=pad_ylabel)
    plt.xlabel('Autonomous system', fontsize=font_size_label, labelpad=pad_xlabel)
    plt.xticks(fontsize=font_size_ticks - 2, rotation=90)

    axes = plt.gca()
    axes.get_yaxis().set_major_formatter(plt.FuncFormatter(lambda x, loc: "{:,}".format(int(x))))
    plt.savefig("./results/top_ases_list.png", bbox_inches='tight')
    plt.close()
IP blocklist insights
We first have a look at the number of IP addresses included in the list over time. We see that since May 2022, it has stabilized between 60K and 80K IP addresses. The differences we observe over time can be explained mainly by the following reasons:
- There are more or fewer attacks on my honeypots;
- I used a different number of proxy providers over time;
- I adjusted my proxy budget.

When it comes to the cumulative number of IP addresses in the list over time, i.e. in total, how many distinct IPs have been present in the blocklist at some point, we see that around 800,000 malicious IP addresses have been flagged in 8 months, which represents 100,000 distinct IP addresses monthly.

We can look at the CDF of the duration IP addresses were included in the list to understand whether or not IP addresses remain in the list for a long time. What we observe on the CDF graph below, is that around 65% of the IPs that were in the list got flagged only once since they appear at most 7 days in the list, which is the minimum duration an IP can stay in the blocklist if it’s flagged only once. Disclaimer, this doesn’t necessarily mean these IPs ceased to be malicious. Unfortunately, this has more to do with my data collection protocol. We can only infer that I didn’t observe any more malicious activity from these IPs. However, we also see that some IPs remain on the list for a longer period:
- 10.3% of the IPs have been included in the list for > 1 month;
- 4.5% of the IPs have been included in the list for > 1 month.
These IP addresses tend to come from the following autonomous systems:
- M247 Ltd;
- QUICKPACKET;
- HostRoyale Technologies Pvt Ltd;
- Digital Energy Technologies Ltd. These are data-center autonomous systems commonly used by bots. However, be careful if you wanted to completely block them, some of them, such as M247 are also used by several popular VPN providers.

The top 3 autonomous systems whose IP addresses are the most frequently flagged as proxies or used by bots are 1) Korea Telecom, 2) AS Coloam and 3) Chinanet. However, we also observe a long tail of data-center and residential autonomous systems from which originates a significant volume of malicious traffic, such as M247 Ltd, HKT Limited, and Telefonica Brasil.

If you are interested in more fine-grained data, I also generated a list of the top 450K IPs that stayed the longest in the list.
Conclusion
In this blog post, we showed how you can use Git-python and Matplotlib to analyze the Avastel all infected IPs 7d blocklist, a blocklist that contains recent IP addresses that have been flagged as malicious/used by bots.
We showed that over the last 8 months, we gathered around 800,000 malicious IP addresses in this blocklist, which represents 100,000 distinct malicious IPs monthly. While the majority of these IP addresses remain on the list for less than a week, we showed that a minority of IP addresses (~4.5%) originating from a few data-center autonomous systems (M247 Ltd, QUICKPACKET, HostRoyale Technologies Pvt Ltd, Digital Energy Technologies Ltd.) stayed in the list for more more than three months. Our study of the top autonomous systems linked to IPs present in the blocklist shows that these IPs come both from data-center and residential autonomous systems.
Random fact: I asked Stable diffusion AI model to generate an image that represents an "IP address used as a proxy by bad bots":
img = generator.generate(
    "IP address used as a proxy by bad bots",
    num_steps=10,
    unconditional_guidance_scale=7.5,
    temperature=1,
    batch_size=4,
)
pil_img = Image.fromarray(img[0])
display(pil_img)
I’m not convinced by its proposal, seems like we’ll have to find other approaches to detect proxies and bad bots until AI improves!

This content originally appeared on / and was authored by antoinevastel.com
antoinevastel.com | Sciencx (2022-09-24T00:00:00+00:00) Exploring the Avastel all infected IPs 7d blocklist using Git-python and Matplotlib. Retrieved from https://www.scien.cx/2022/09/24/exploring-the-avastel-all-infected-ips-7d-blocklist-using-git-python-and-matplotlib/
Please log in to upload a file.
There are no updates yet.
Click the Upload button above to add an update.
