This content originally appeared on DEV Community and was authored by Dominika Zając (she/her) 🇵🇱
Today’s article is addressed mainly to those who are starting their journey in IT. Recently, I work a lot with people who are learning their first programming language or want to switch careers to tech and I noticed that many tutorials are showing how to build stuff but almost never how to read existing code, debug mistakes or find a way to fix a bug. And it’s surprising as in “real life” we often work with existing codebase (adding a new feature, fixing bugs, changing business logic, etc) than writing the code from the scratch. Also, it’s super important to know ways to find a problem in your code — not only go step by step from the tutorial. In this article, I want to show you some features available for free in your Chrome browser which can help you address those problems. I hope it will inspire you to experiment more with programming and become a better developer!
What Chrome DevTools are
Let’s start with a short intro about Chrome DevTools. It’s a set of developer tools built into the Chrome browser and available completely for free. To start using them you just need to open the page to test in Chrome browser and open Chrome DevTools. You can do it in many ways:
Right-click on any element on the page and choose Inspect option from menu
Use 3 dots menu in the top right side of the browser -> Choose More tools and later -> Developer tools option
Use shortcut (ctrl + shift + I on Linux/Windows or cmd + shift + I on Mac)
After that, you’ll see a panel similar to the one visible in the screenshot below.
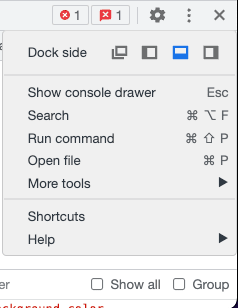
Tip: Your panel can be visible as a separate window or on the right/left/bottom side of the page. If you want to change that, find the 3 dots menu in the top right part of the Chrome DevTools panel and click the preferred mode in Dock side option.
There are many tabs and options available but in today's article, we'll focus on the most basic one - Elements. It is mostly used to preview the HTML structure and styling of the page. What can we do here?
Preview the HTML structure of the whole page
Yes, I said it before but let's extend this topic a little. As you can see in the Elements tab you can preview all HTML nodes visible on the page. Why it's important? You can e.g. check if all components are displayed correctly (it's a super popular mistake among beginners to create a separate component for some widgets and forget to use them on the page). You can also check the order of elements on the page and nest (which element is inside which). To extend/collapse the node, just use the arrow at the beginning of the line.
Preview of a specific node
When you see some problems on your webpage, you may want to focus on a specific area/node instead of looking at the whole page. There are several ways to do so: you can just right-click on the element on the page and choose the Inspect option from the menu (it works even if Chrome DevTools are not opened on the page), you can find the element in the Elements preview by extending sections, or you can click the selector icon in the Chrome DevTools (on the top left side of the panel) and select the node on the page.
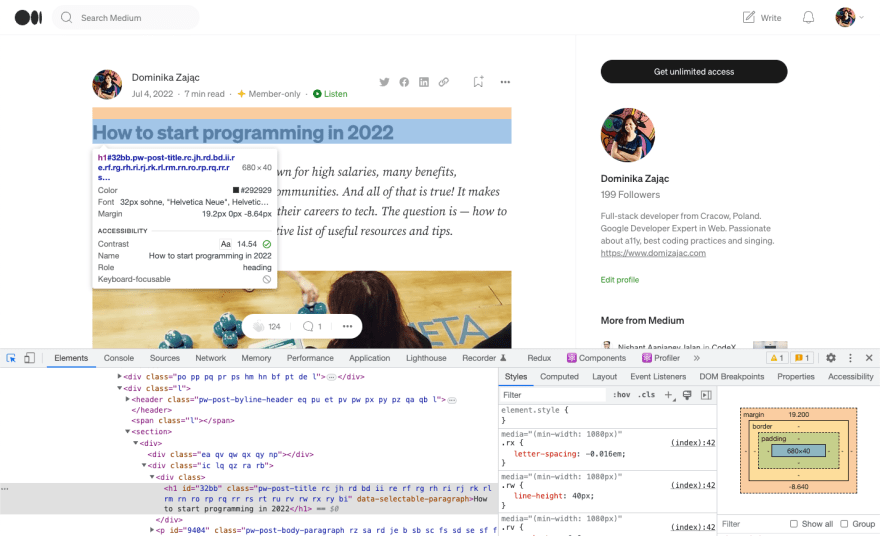
After selecting the given node will be highlighted in the Elements preview in the DevTools panel, so you can see which exact HTML tag is responsible for displaying the given part. This element will be also highlighted on the page with additional info - the margin part will be marked in orange, padding in green and a small popup will show a preview of styling applied on the element. You can see it in the screenshot below
What we can see here? "How to start programming in 2022" is a header element marked with an h1 tag with id="32bb" and many styling classes applied (don't worry about their naming - it's the effect of Javascript uglification and minification on the page making source code smaller, loading faster and more difficult to steal by other developers :) ). The popup is showing us a summary of styling - color, font, margins, and contrast of the element. The orange area is showing the top margin applied to this element (notice that in DevTools there is a colorful box visible on the right side - from this, we can read that the top margin has 19.2px). There is also a section with info about all styles applied to this element. I'll write a little more about styling in the section below but don't be afraid to play a little with all those options. You can't break anything with that - I promise (all your changes will be removed after reloading the page).
Hide/edit/delete/duplicate given element
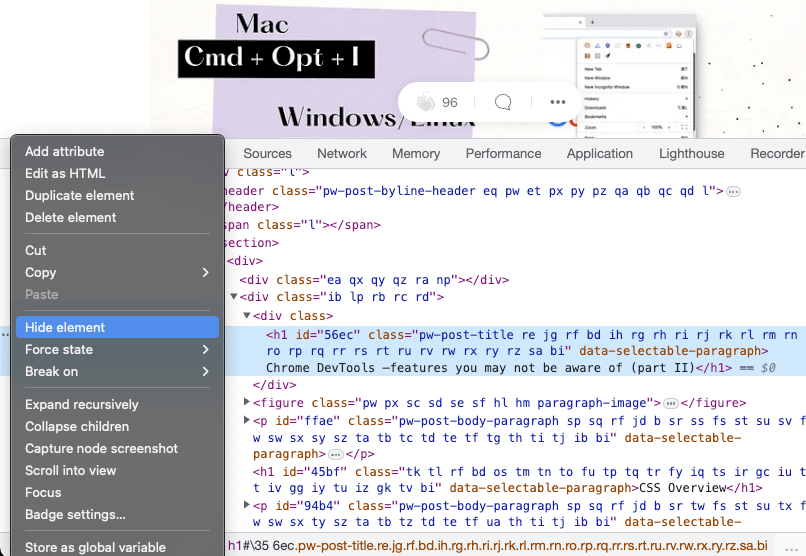
When you want to quickly preview some changes on the page, you can modify elements directly on the page using Chrome DevTools. Just select the node you are interested in and right-click on it in the Elements tab or click the 3 dots menu at the beginning on the line with the element. After that, you'll see a menu with many options e.g. to hide/edit/delete or duplicate a given element, add an attribute, edit as HTML, etc. Select the one you are interested in and see the visual changes on the page.
Important: it's only a preview, your changes won't be saved after reloading the page.
Change the styling of the element
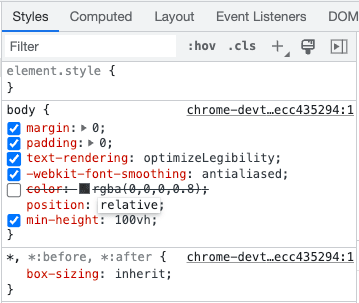
It's one of my favorite options here - previewing styling changes to the element. You don't have to do changes locally and wait to reload the page each time you change one property. Or you can preview how the page you have no access to will look e.g. with different font colors. Just select the given node as I described in previous sections and look at the Styles tab close to the HTML tree. In the first view, you can see all CSS classes applied to the element, you can change their values (just double-click on the value), add new properties, etc. You can also uncheck the checkbox close to the attribute to disable the given rule. When some rule is crossed out it means some other properties override it.
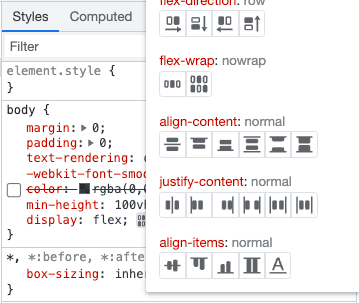
When it's possible, autosuggestion will propose available values for given property (sometimes with visual tips on what they mean), so it's an easy way to find e.g. correct option when you don't remember the exact name of the property's value!
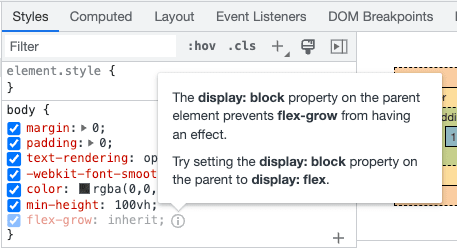
In one of the recent releases, Chrome added also information when some rule cannot be applied to a given element. You can recognize it by greyed letters and the 'i' icon close to the value. When you hover over the 'i' icon, you'll see a popup with an explanation of why a given rule cannot be applied.
Important: remember that those changes are not saved and will be removed after reloading the page!
There are many, many other options available for styling here (so strongly recommend just playing with it), but I want you to focus on one more thing - close to the 'Styles' tab there is also the 'Computed' tab. You can use it to easily preview all rules applied to the element without splitting them into CSS classes.
Toggle element state
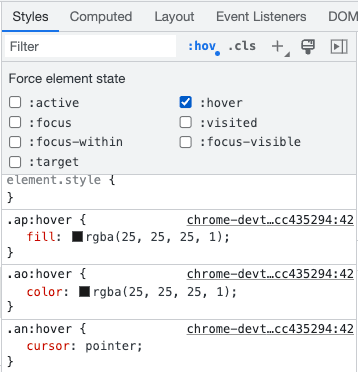
Sometimes elements on the page look differently depending on their state - e.g. visited link looks differently than an unvisited one, the button may have different background color on mouse hover, etc. Fortunately, you can easily play with the styling of different element states too. Just select the given node, find the :hov button in the Styles tab, and toggle the checkbox on the state you want to force. Thanks to that, even if you stop e.g. hovering over the element, you can still preview and edit styles applied in this state.
Reorder elements on the page
Sometimes you may want to rearrange elements on your webpage but you are not sure which order is the best. Fortunately, you can easily preview it! Just select the element you want to move in the Elements tab in Chrome DevTools, drag it, and drop it in the correct place. That's it! A new order will be visible in the UI until you reload the page.
Previewing mobile/responsive mode
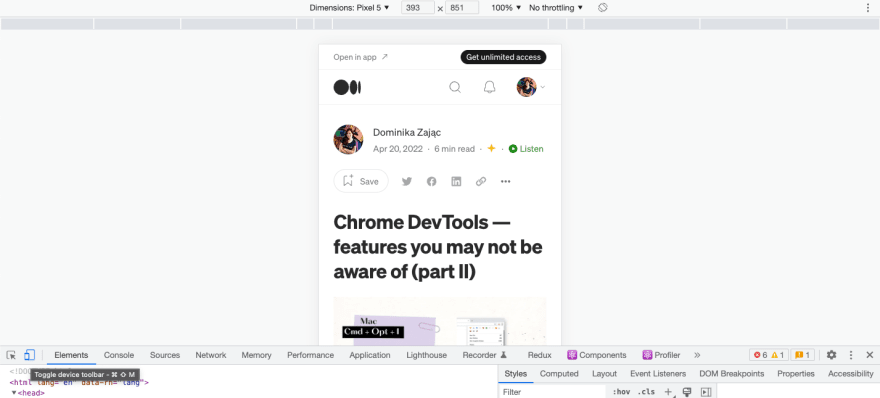
Modern web development is not easy - we have to ensure our webpages will look good not only on laptops but also on mobile, tablets, big screens, etc. And Chrome DevTools may be useful also in case of checking the responsiveness of our webpage. Just click the mobile preview button close to the selector icon (the second icon from the left in the top menu) and later choose the device, width, height, and device orientation in the menu visible above the page preview. Play with different dimensions - thanks to that you can notice some problems with your webpage behavior on different devices!
A webpage preview on Pixel 5 phone. Notice the icon to enable responsive mode - it's marked in blue with a tooltip below it.
Summary
Of course, the options described in this article are not the only ones available in Chrome DevTools - you may be surprised how many awesome features are available here (I wrote about the less-known ones in my preview article). Feel free to experiment and play with this tool a little - I'm sure it will help you to better understand and easier debug your projects.
This content originally appeared on DEV Community and was authored by Dominika Zając (she/her) 🇵🇱
Dominika Zając (she/her) 🇵🇱 | Sciencx (2023-03-25T17:50:15+00:00) How to use Chrome DevTools to debug HTML/CSS on your webpage — intro for beginners. Retrieved from https://www.scien.cx/2023/03/25/how-to-use-chrome-devtools-to-debug-html-css-on-your-webpage-intro-for-beginners/
Please log in to upload a file.
There are no updates yet.
Click the Upload button above to add an update.


