This content originally appeared on Telerik Blogs and was authored by Nada Rifki
Nuxt DevTools is a game changer, and this post shares what’s so exciting about it. It’s one of the best developer tools around and provides a full-stack experience unlike any other.
Nuxt DevTools ships by default in Nuxt and has been getting a lot of attention. Honestly, it’s probably the best developer tool around right now and provides you with a full-stack experience unlike any other.
If you don’t know about it yet, it was released during Vue.js Amsterdam in 2023 by Anthony Fu (a core team member of Vue, Vite and Nuxt). While it took me a while to start using it, it would be hard to go back to a project without it.
You are probably familiar with using Chrome or Safari DevTools and don’t want to deal with another layer of inspection. But the Nuxt DevTools is a game changer and I will try to also make you excited about it.
Why Should You Care About Nuxt DevTools?
Reason #1: You will be faster to get productive in an unfamiliar codebase. If you are new to a project, you should open it before diving into the codebase as it will give you a quick overview of many things. I also believe it’s a great way to learn Nuxt faster.
Reason #2: It will improve your developer experience which is the key to great software. For instance, you have an integrated developer’s experience that is very powerful and easy to use, especially if you are using the server routes and the API of Nuxt.
Reason #3: It improves transparency about what Nuxt is doing under the hood. There are a lot of abstractions to Nuxt as it aims to be a zero-config framework. That’s why it’s great sometimes to see what is going on behind the curtain. To give you an example, you can see the timing of things to understand how much time it takes to run. You can inspect what is happening in your app in real time. There is a lot of magic in Nuxt, and the Nuxt DevTools allows you to put back the curtain and see what is going on behind the scenes. It is about making stuff visible with less friction. ♀️
Reason #4: It’s extensible, interactive and playful. For instance, you can run your unit tests directly from the DevTools with Vitest.
Reason #5: It’s faster to inspect the code of a component than with the Vue Devtools. By the way, it is designed to work together with Vue Devtools so you can use both.
How Are We Going to Proceed?
There are a lot of features in Nuxt DevTools. I will try to cover all the things I enjoy, but I don’t want to flood you with too many images. To keep things digestible, I will create an image for each feature and display a list of every point you should know about this feature.
Also, my goal is to provide you with real-world examples so you can grasp the value each feature can have in your day-to-day work.
Installation
Nuxt DevTools will only work for Nuxt 3.1 and above and ships by default with Nuxt now. But there are two solutions to install it—one for you only and one for everyone on your team.
# Will be installed as a global module and only activated for the projects you enabled.
# The configuration is stored in your ~/.nuxtrc file so it does not affect your team.
npx nuxi@latest devtools enable

# To disable it per project
npx nuxi@latest devtools disable

## You can also install directly in your project but it will be activated for all your team members.
npm i -D @nuxt/devtools

// nuxt.config.ts
export default defineNuxtConfig({
  modules: ['@nuxt/devtools']
})
Restart your Nuxt server and you should see the floating Nuxt icon at the bottom of your page. You can drag this tab anywhere in dev mode. I enjoy putting it in the bottom left corner.
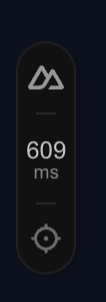
There is an inspect tool you can click to select a component and open the file in your editor. You can see how much time it took to load the page and clicking on the Nuxt icon will open the DevTools. You are also one shortcut away with Shift + Alt / ⇧ Shift + ⌥ Option + D to toggle it. ♀️
It’s a floating panel that you can resize as you wish, so feel free to move it anywhere on your app.
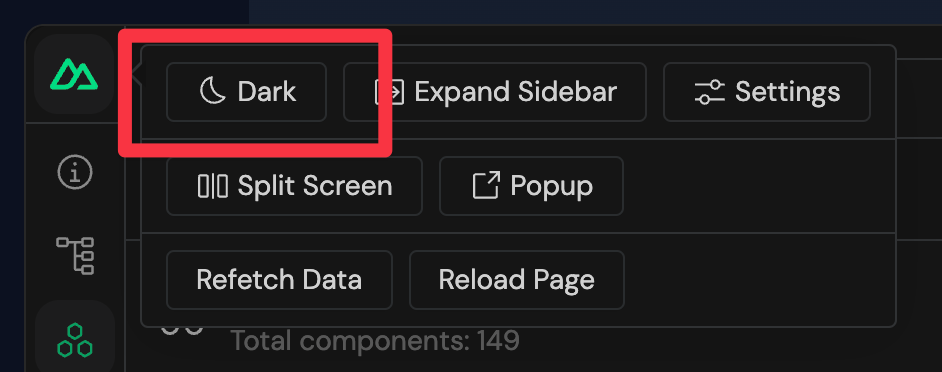
Tips: You can toggle light and dark modes by clicking on the Nuxt icon and even split the screen to open two tabs of the DevTools side by side. ♀️
The Different Features of Nuxt DevTools
Feature #1: Overview
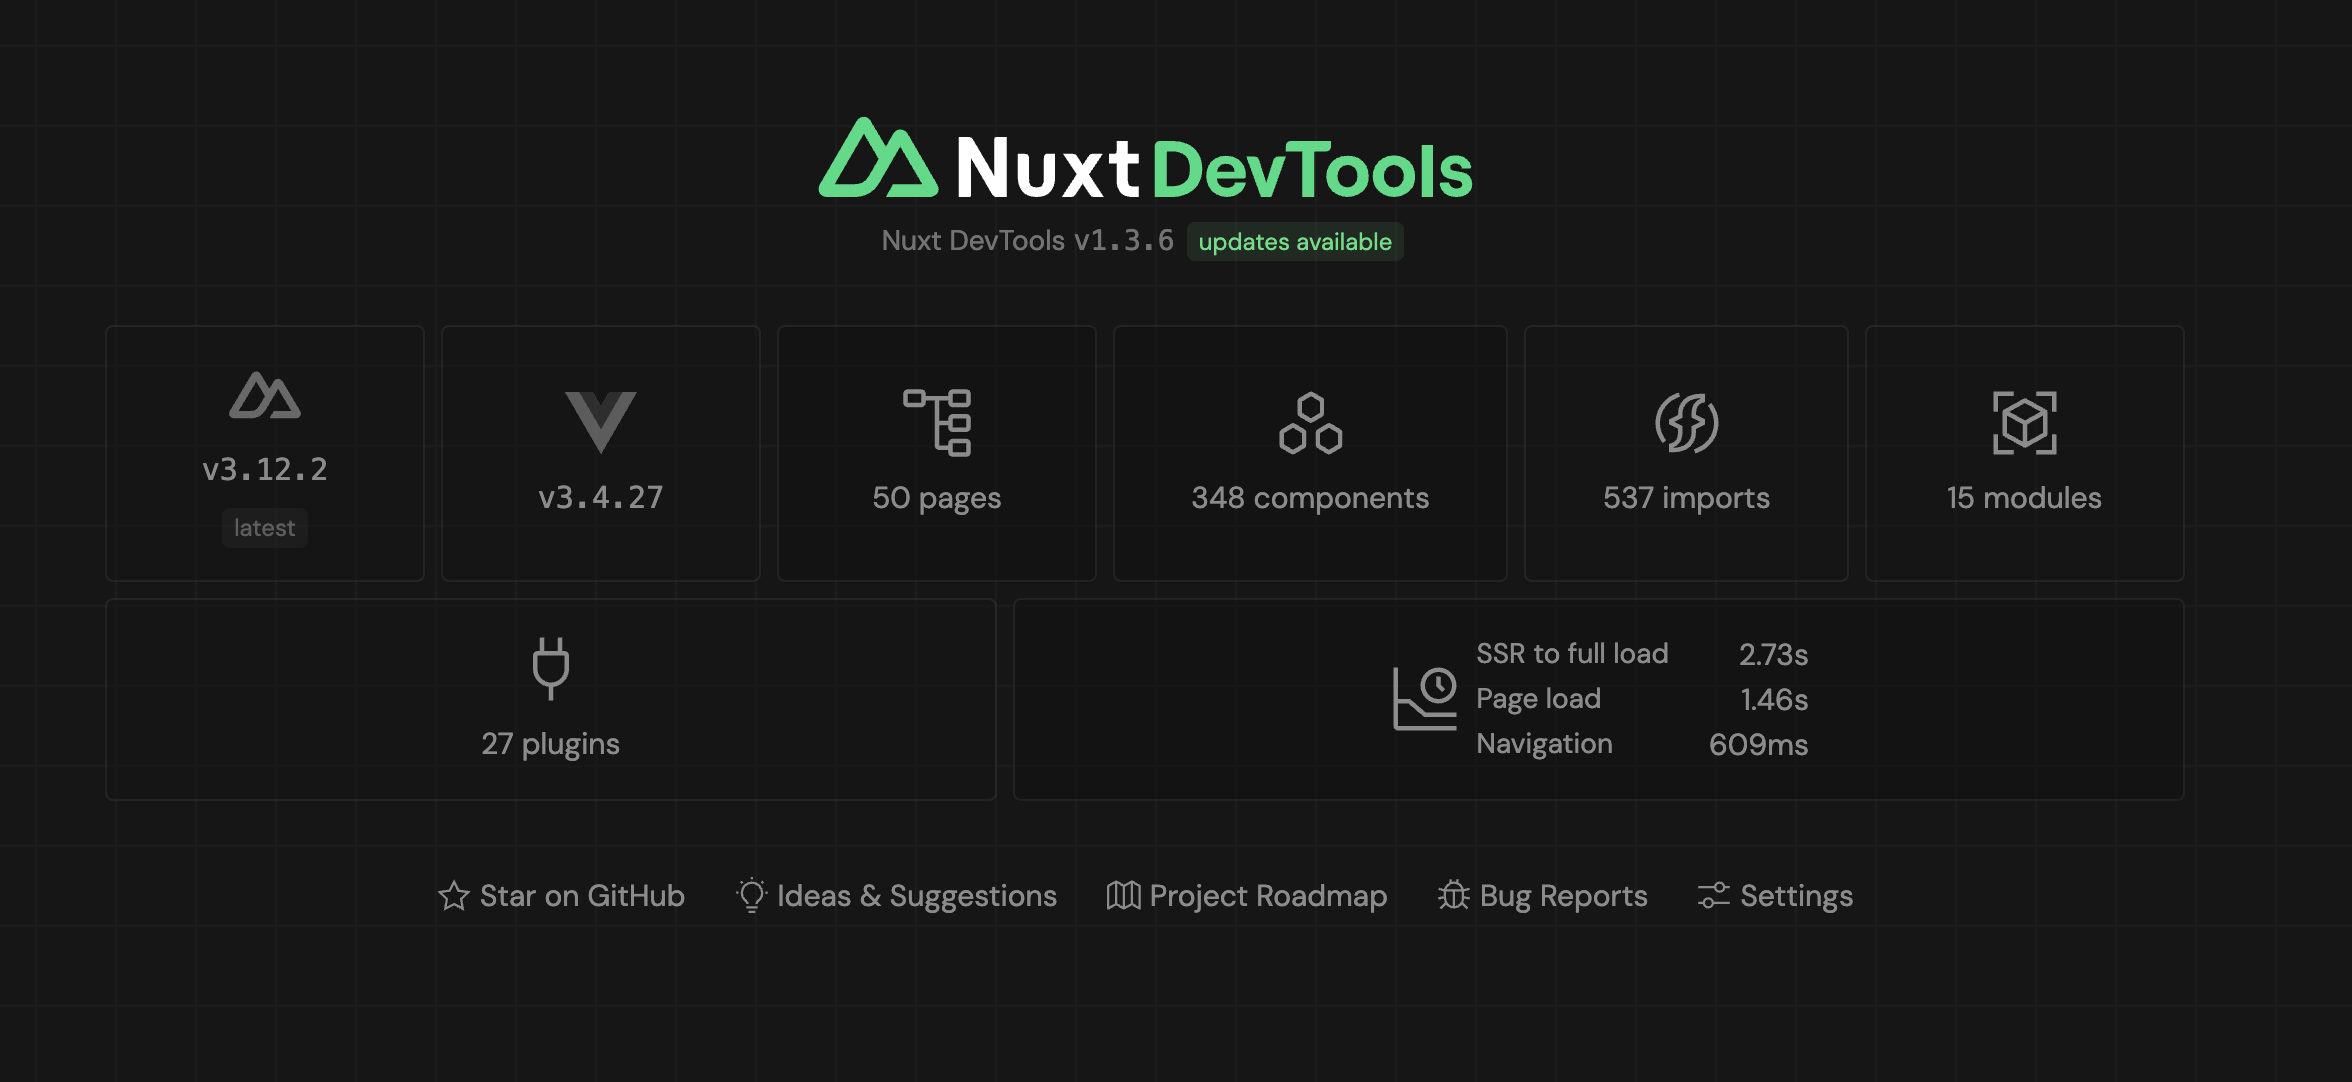
- Display a quick overview of your app. Your Nuxt version and its update status as well as the Vue version.
- The number of pages, components, imports, modules and plugins.
- The details of your app’s loading time.
Feature #2: Pages
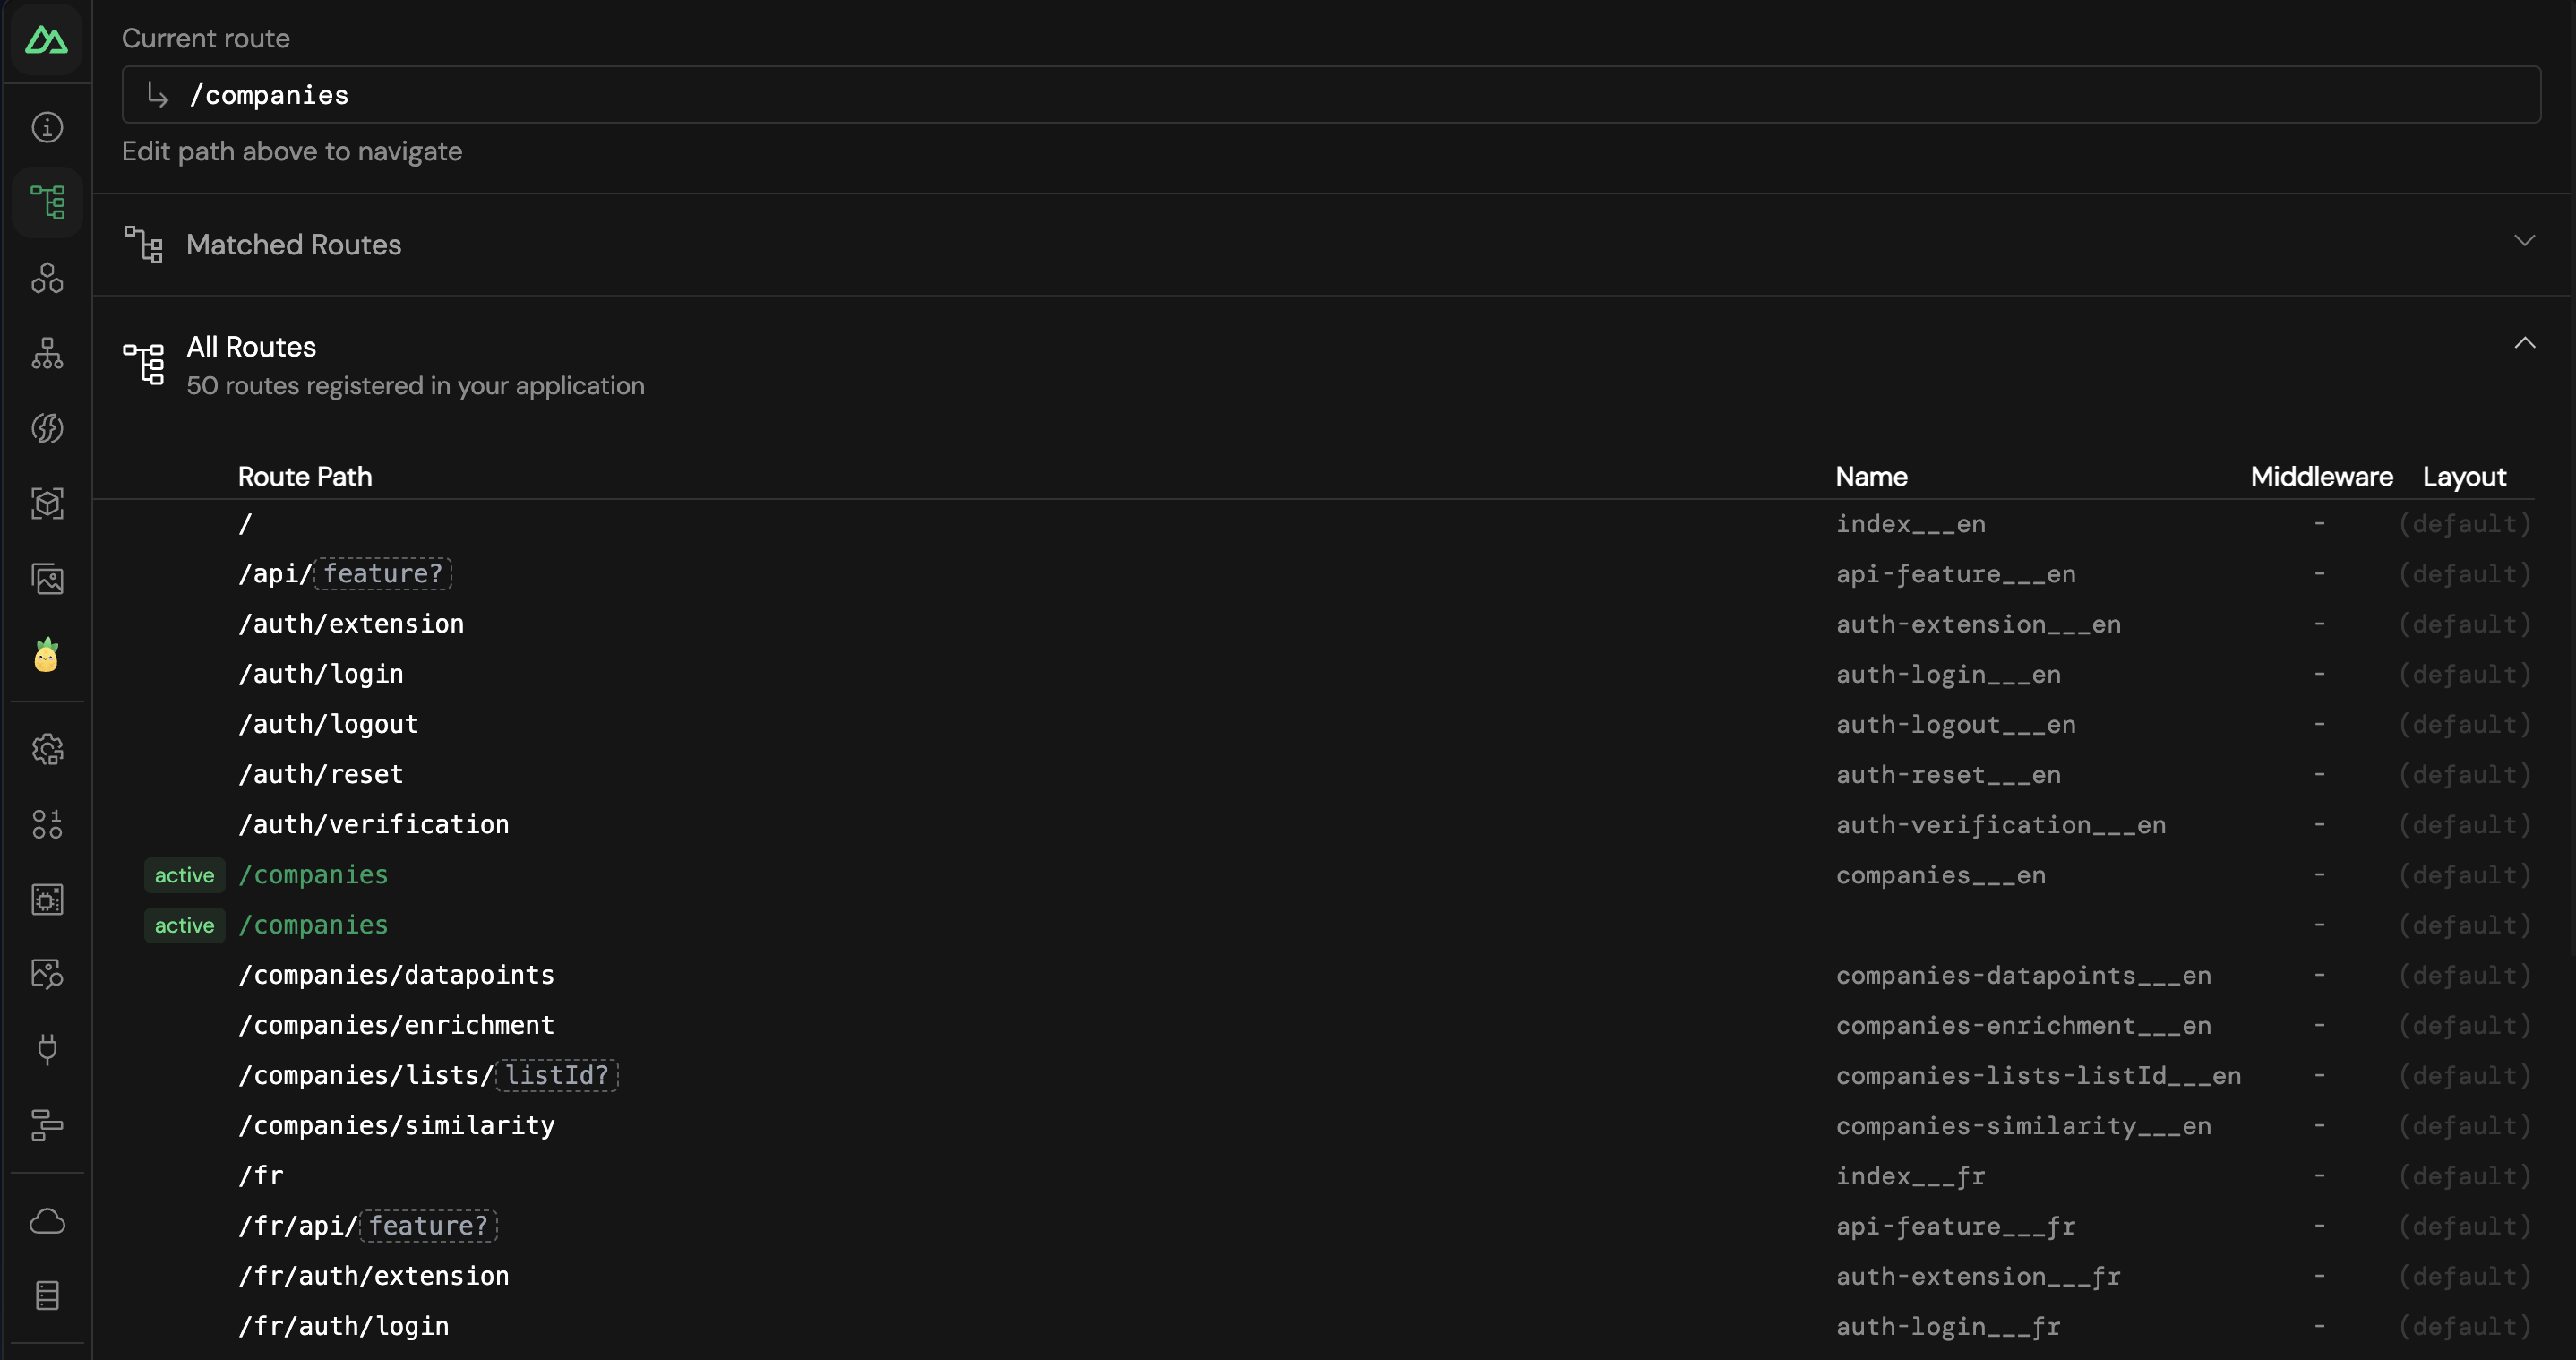
- See all the registered routes of your app.
- Quickly navigate to a specific route (just click on it).
- Open the source file for the page (click on the icon).
- See the route that matches.
- Update the param of a route (just click on the textbox).
- See all registered middleware.
Feature #3: Components
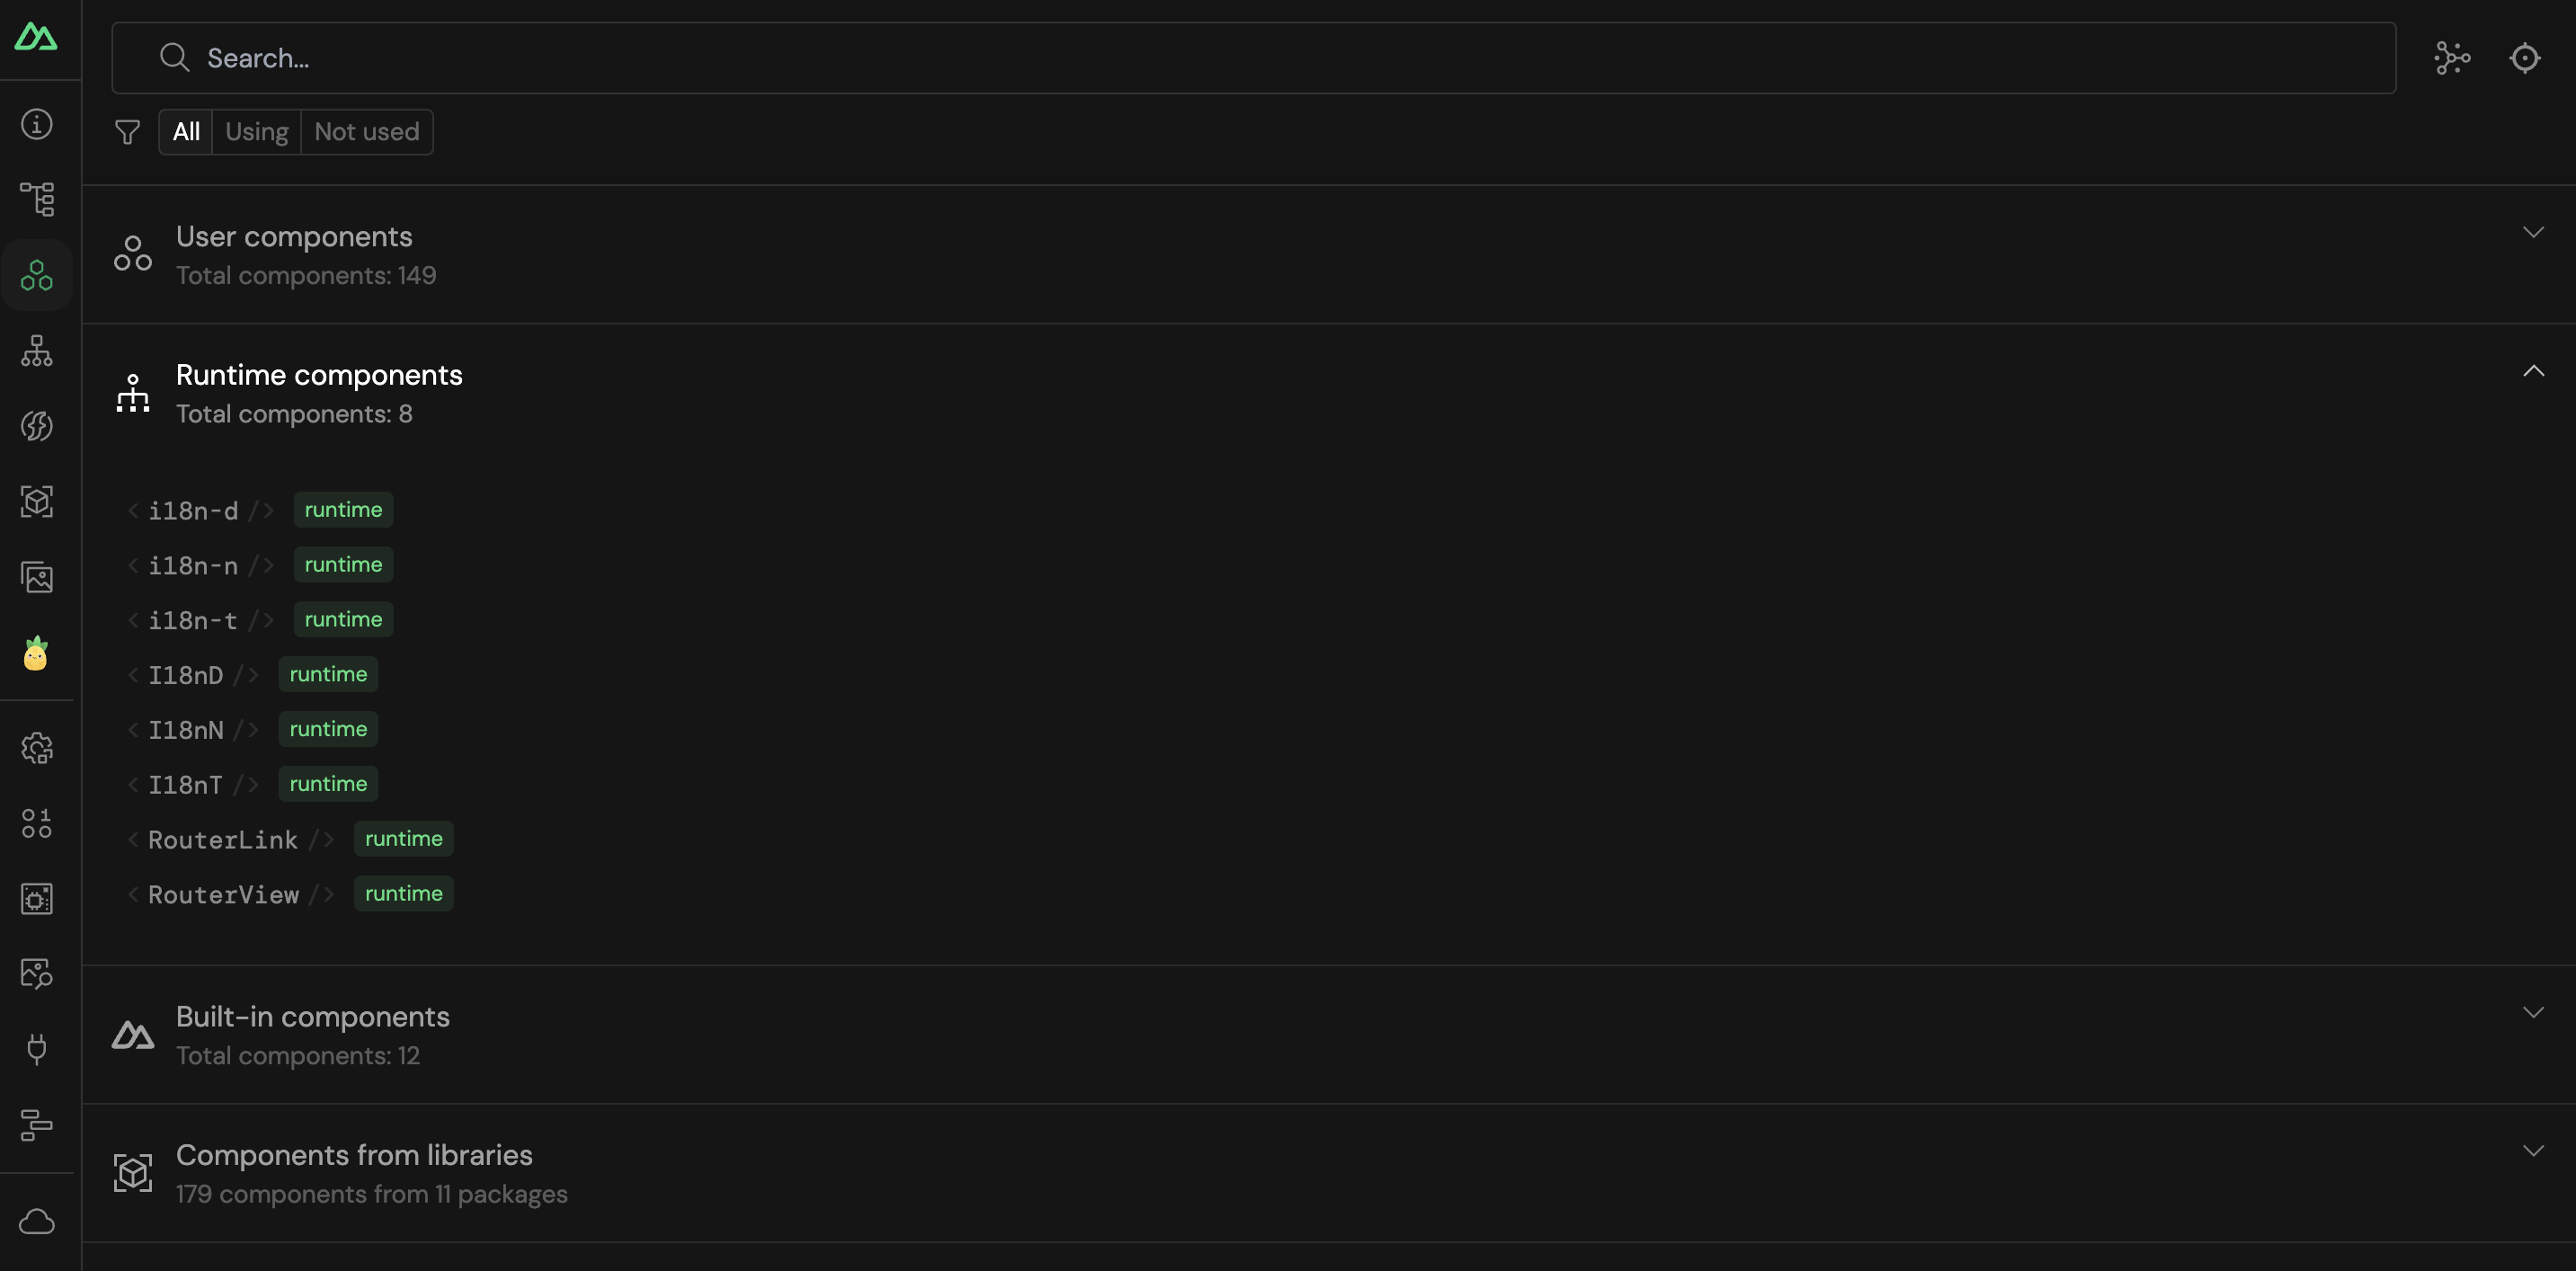
- Browse all components by type: the user components, the runtime components, the built-in components and the third-party components from libraries.
- Open the source file for the component (just click on it). ♀️
- View a graph about how all your components are connected (interactive map).
- Highlight a component like a button and it will redirect you not to the component but to the exact line of code in the source file. This is very useful when you are not familiar with the codebase and you need to edit something.
- See the relationship between each component to see for instance which components are using this specific component.
Feature #4: Components Tree

- See the component tree of your app.
- Analyze the props, the slots, the events and the refs of each component.
- See the state of each component.
Feature #5: Imports
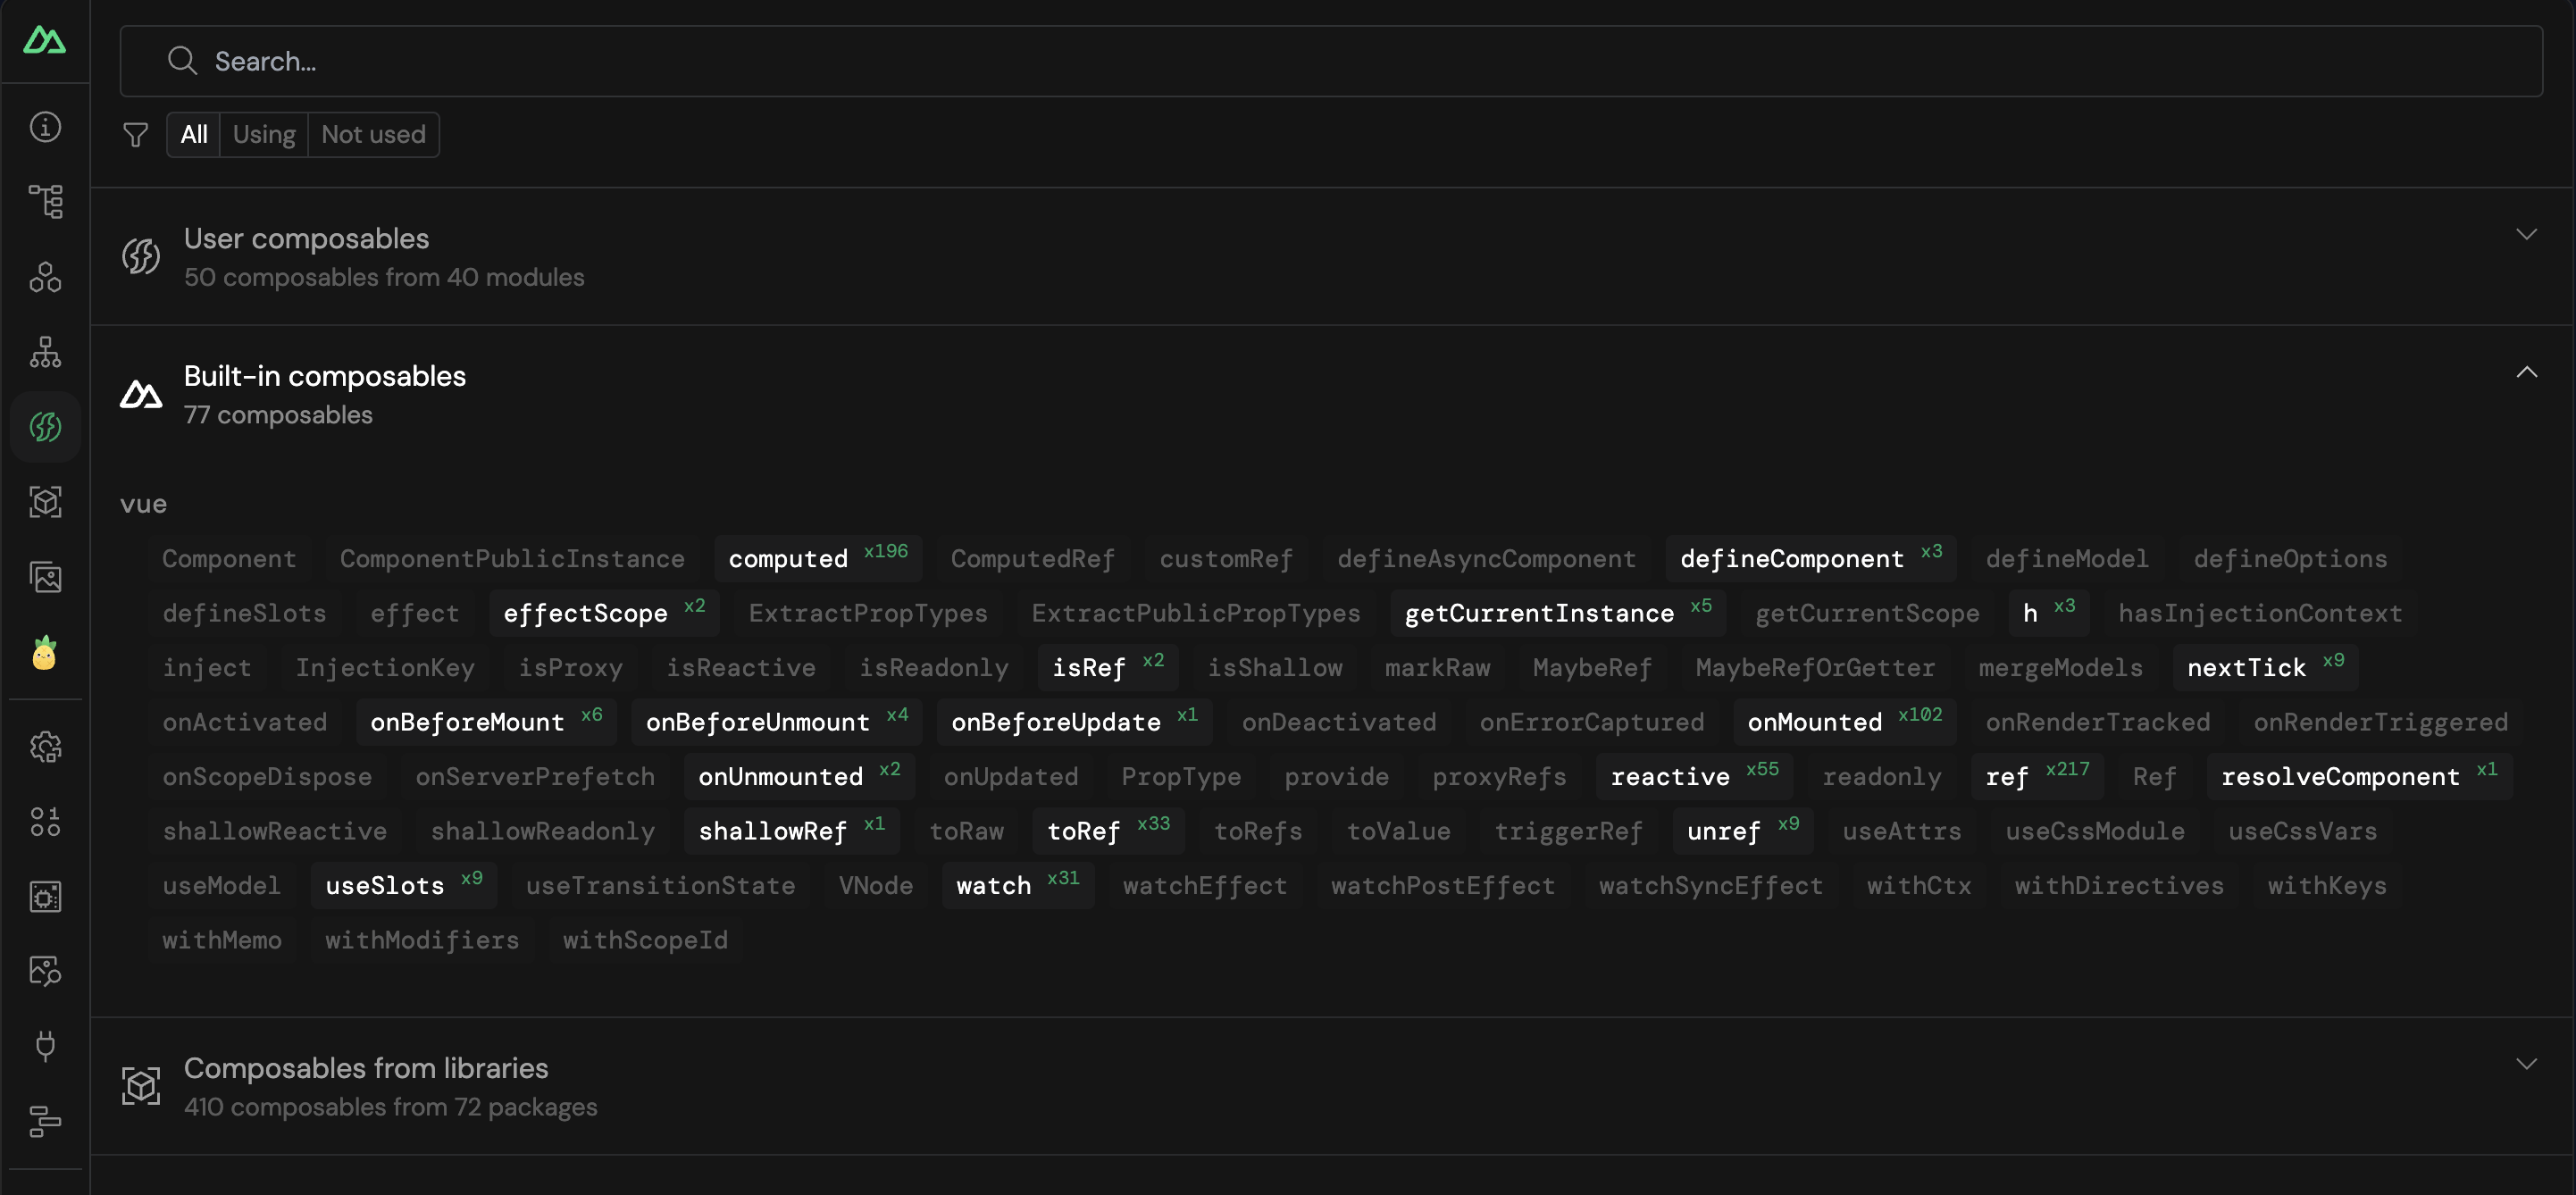
- See what has been imported since Nuxt auto-imported everything: the user composables, the built-in composables and the composables from other libraries.
- The ones that are highlighted are the ones that are being used. You can toggle “show used only” to see only the ones that are being used. ♀️
- See which files are using them. There are always a lot of imports.
- The timeline view (experimental) to see the stack trace of composables.
- See the docs for a specific composable as some entries can also provide short descriptions and documentation links.
Feature #6: Modules & Plugins
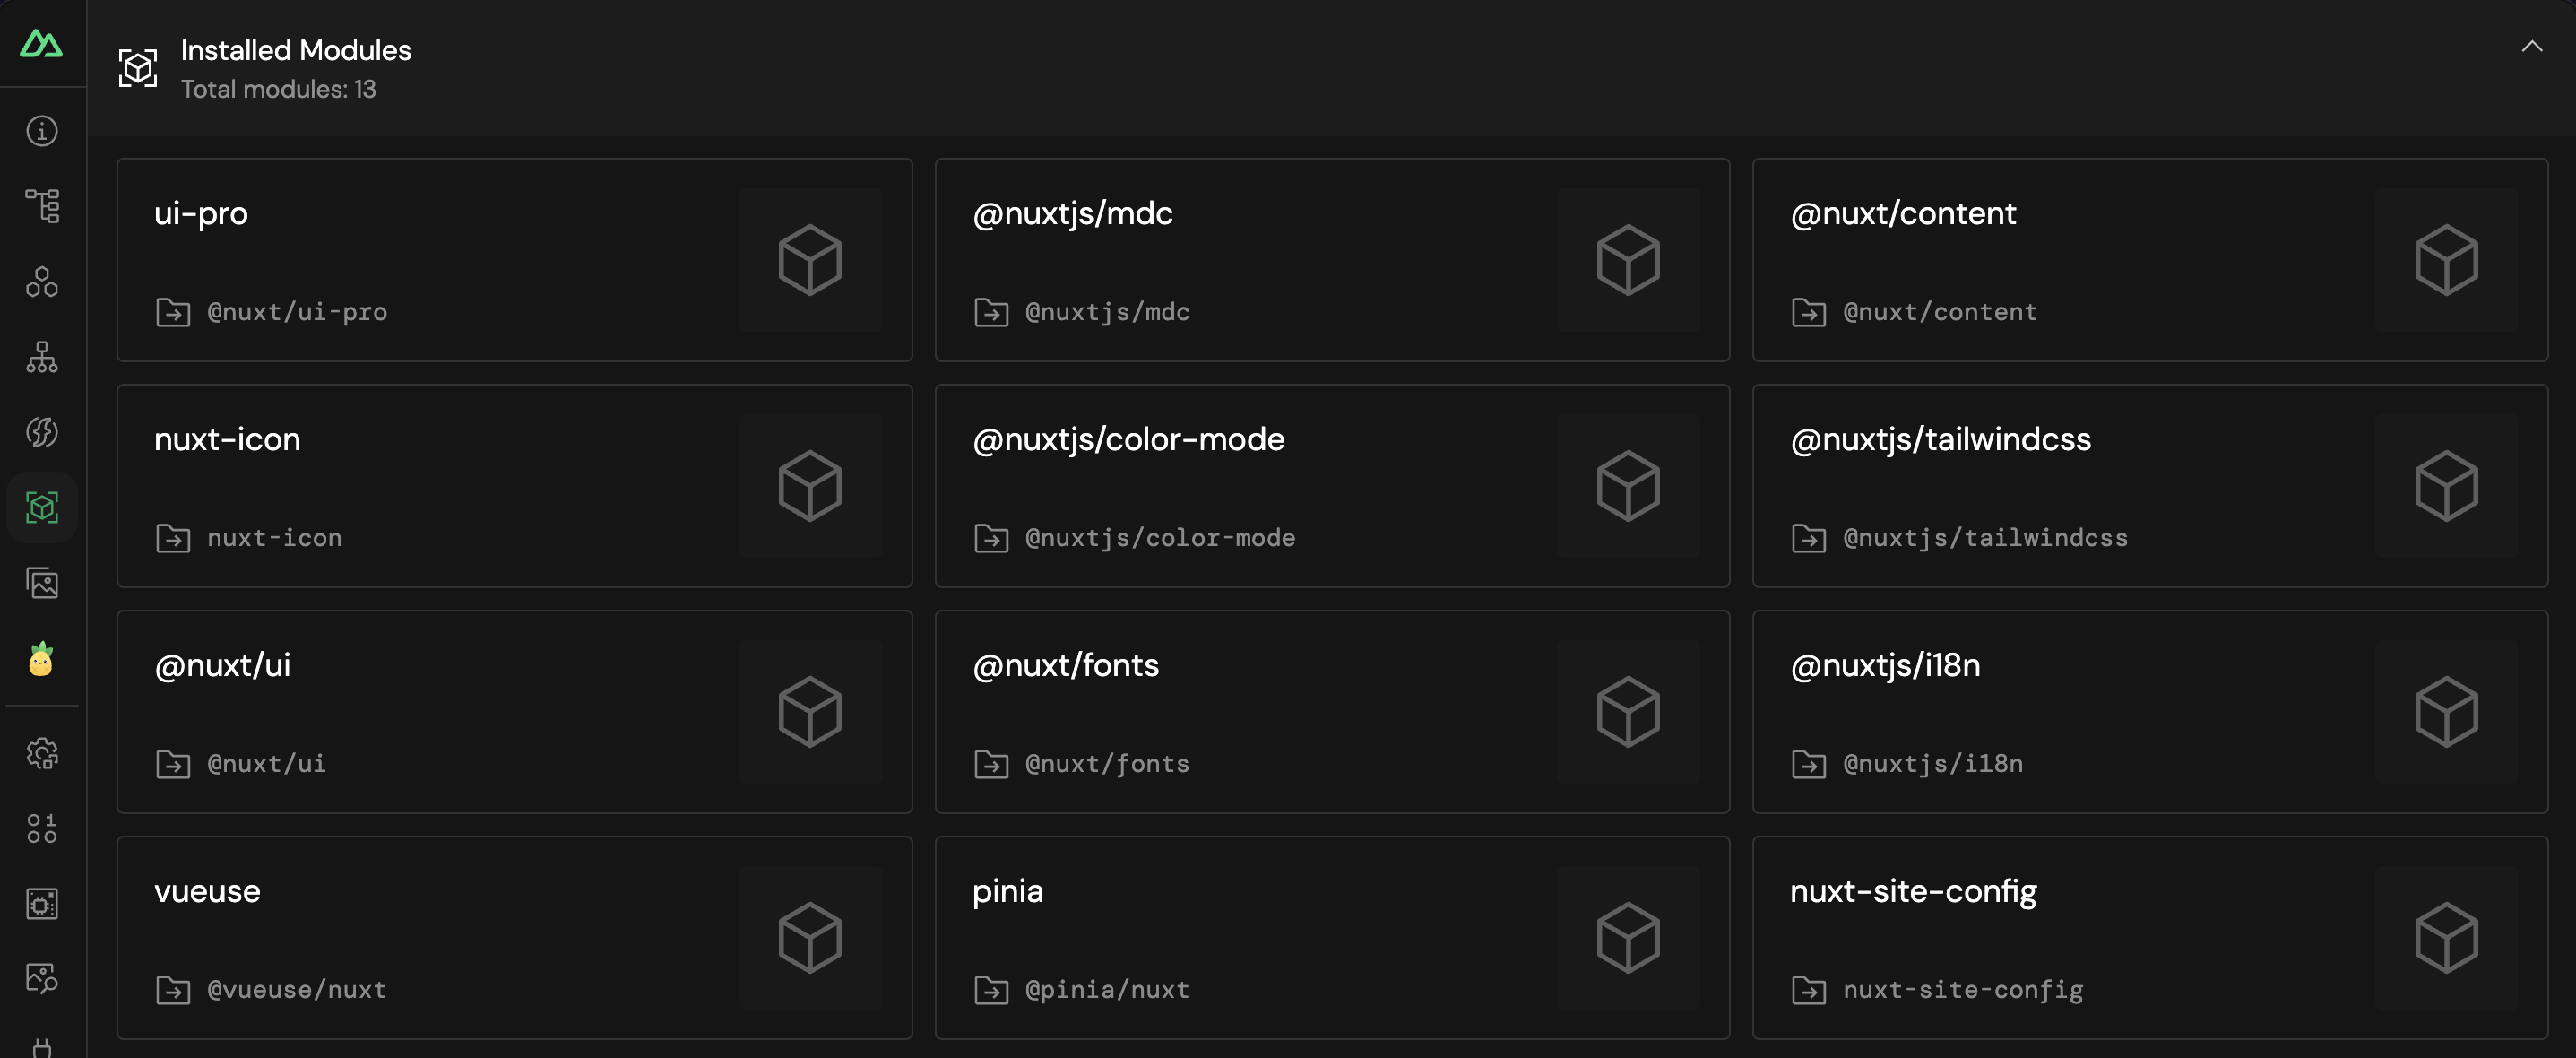
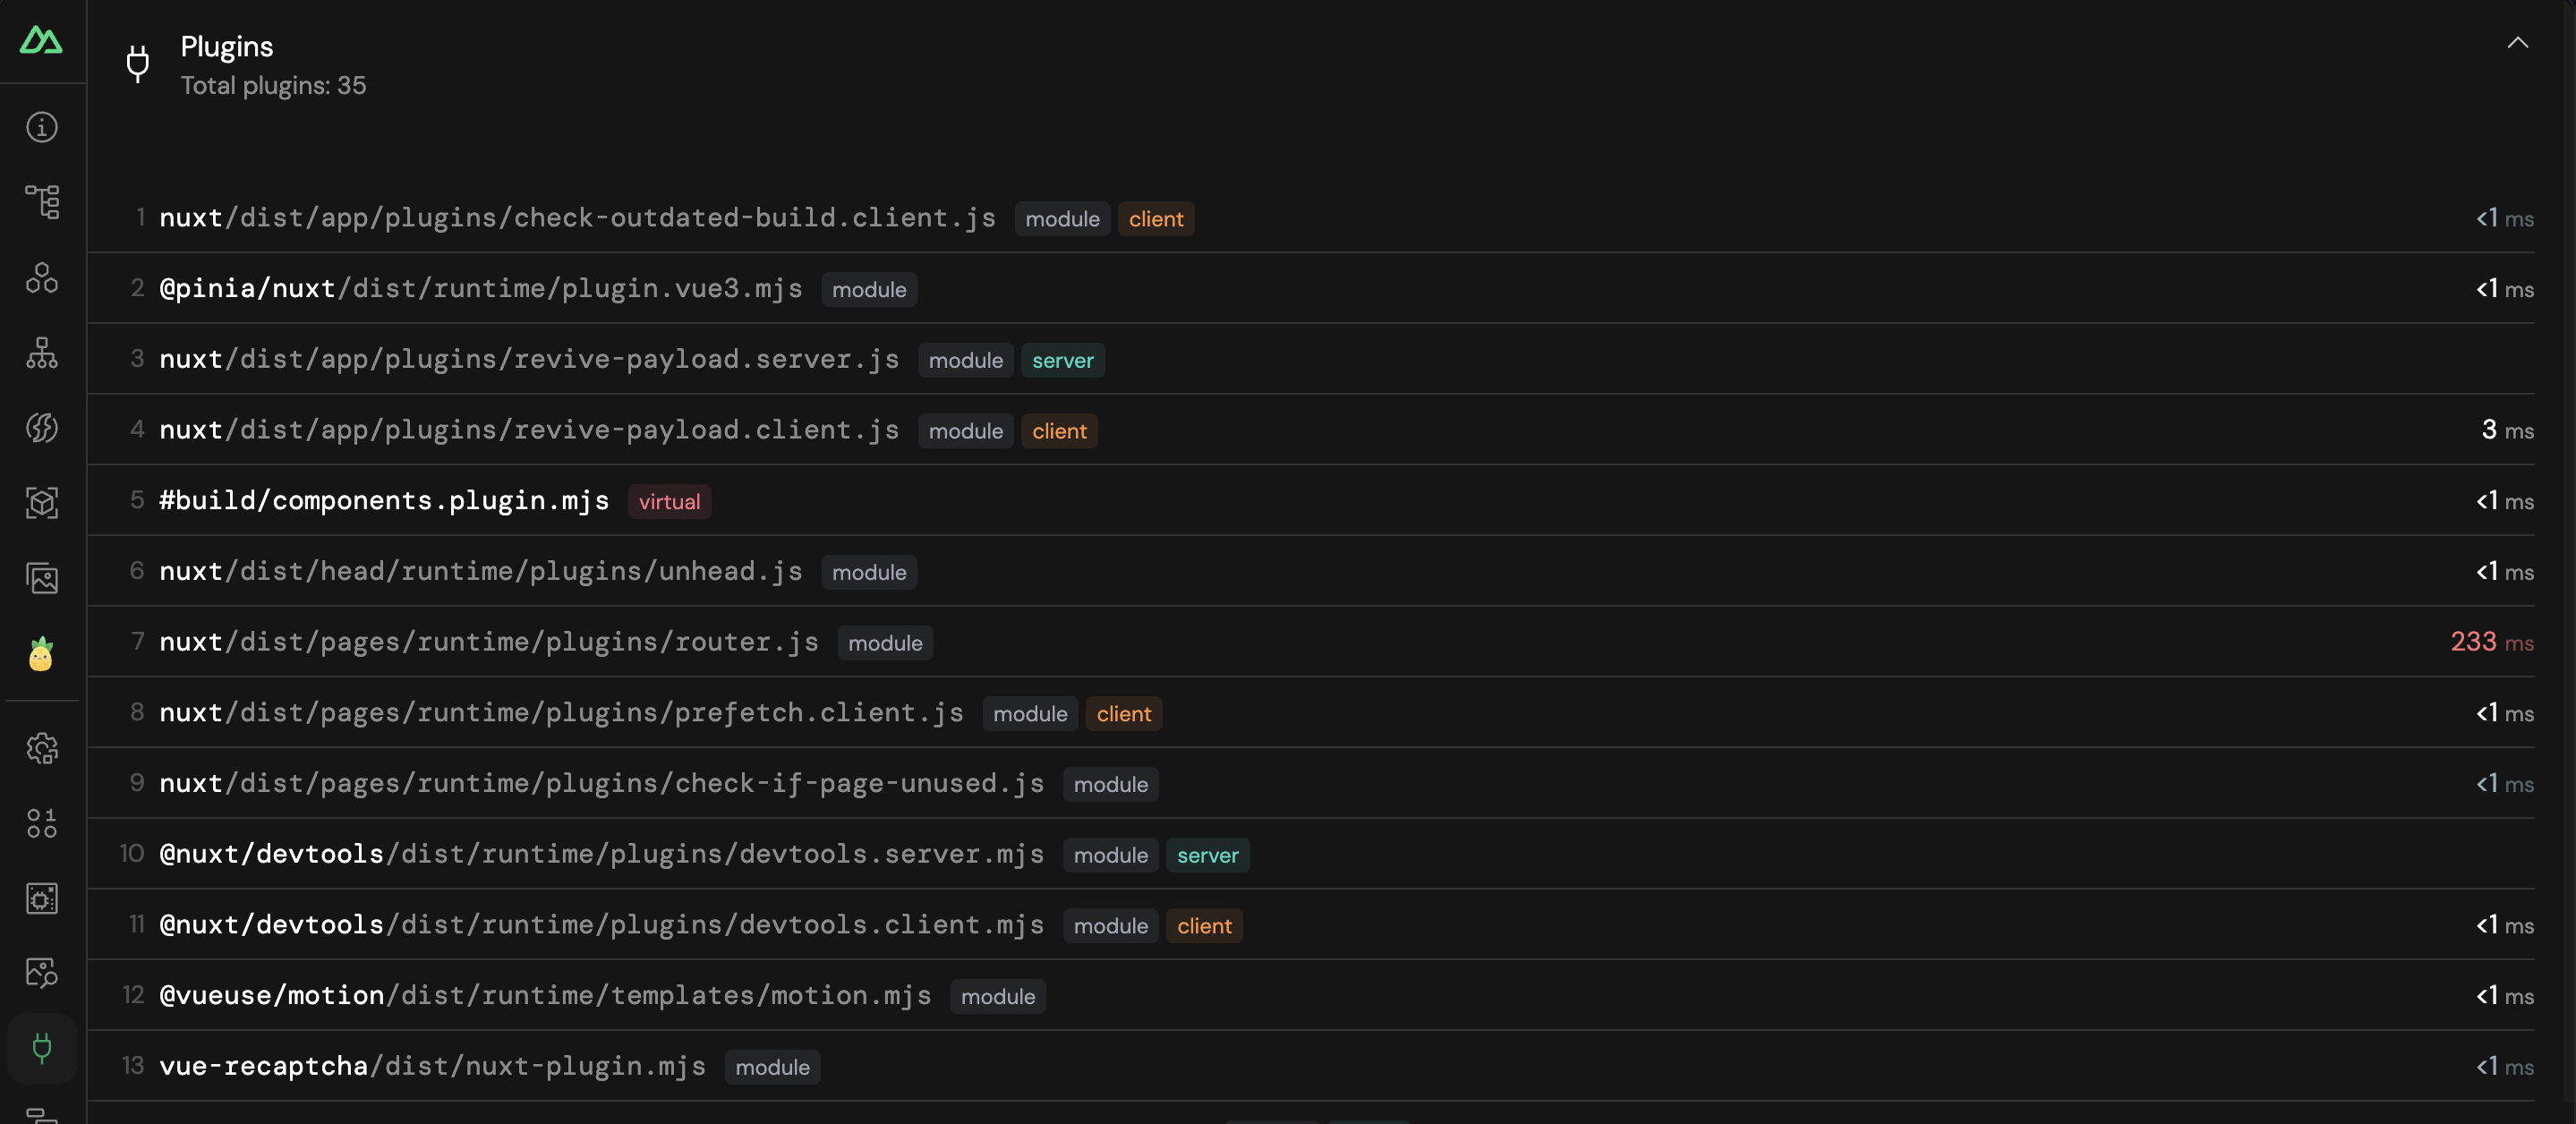
- See the modules you are using in your project, the information about them and a link to their documentation. It can be handy when you are a new developer in a project you are not familiar with.
- Install a module in one click. For instance, if you want to install Tailwind in a snap or Google Fonts.
- Optimize the loading time by watching the plugins tab.
Feature #7: Assets Manager
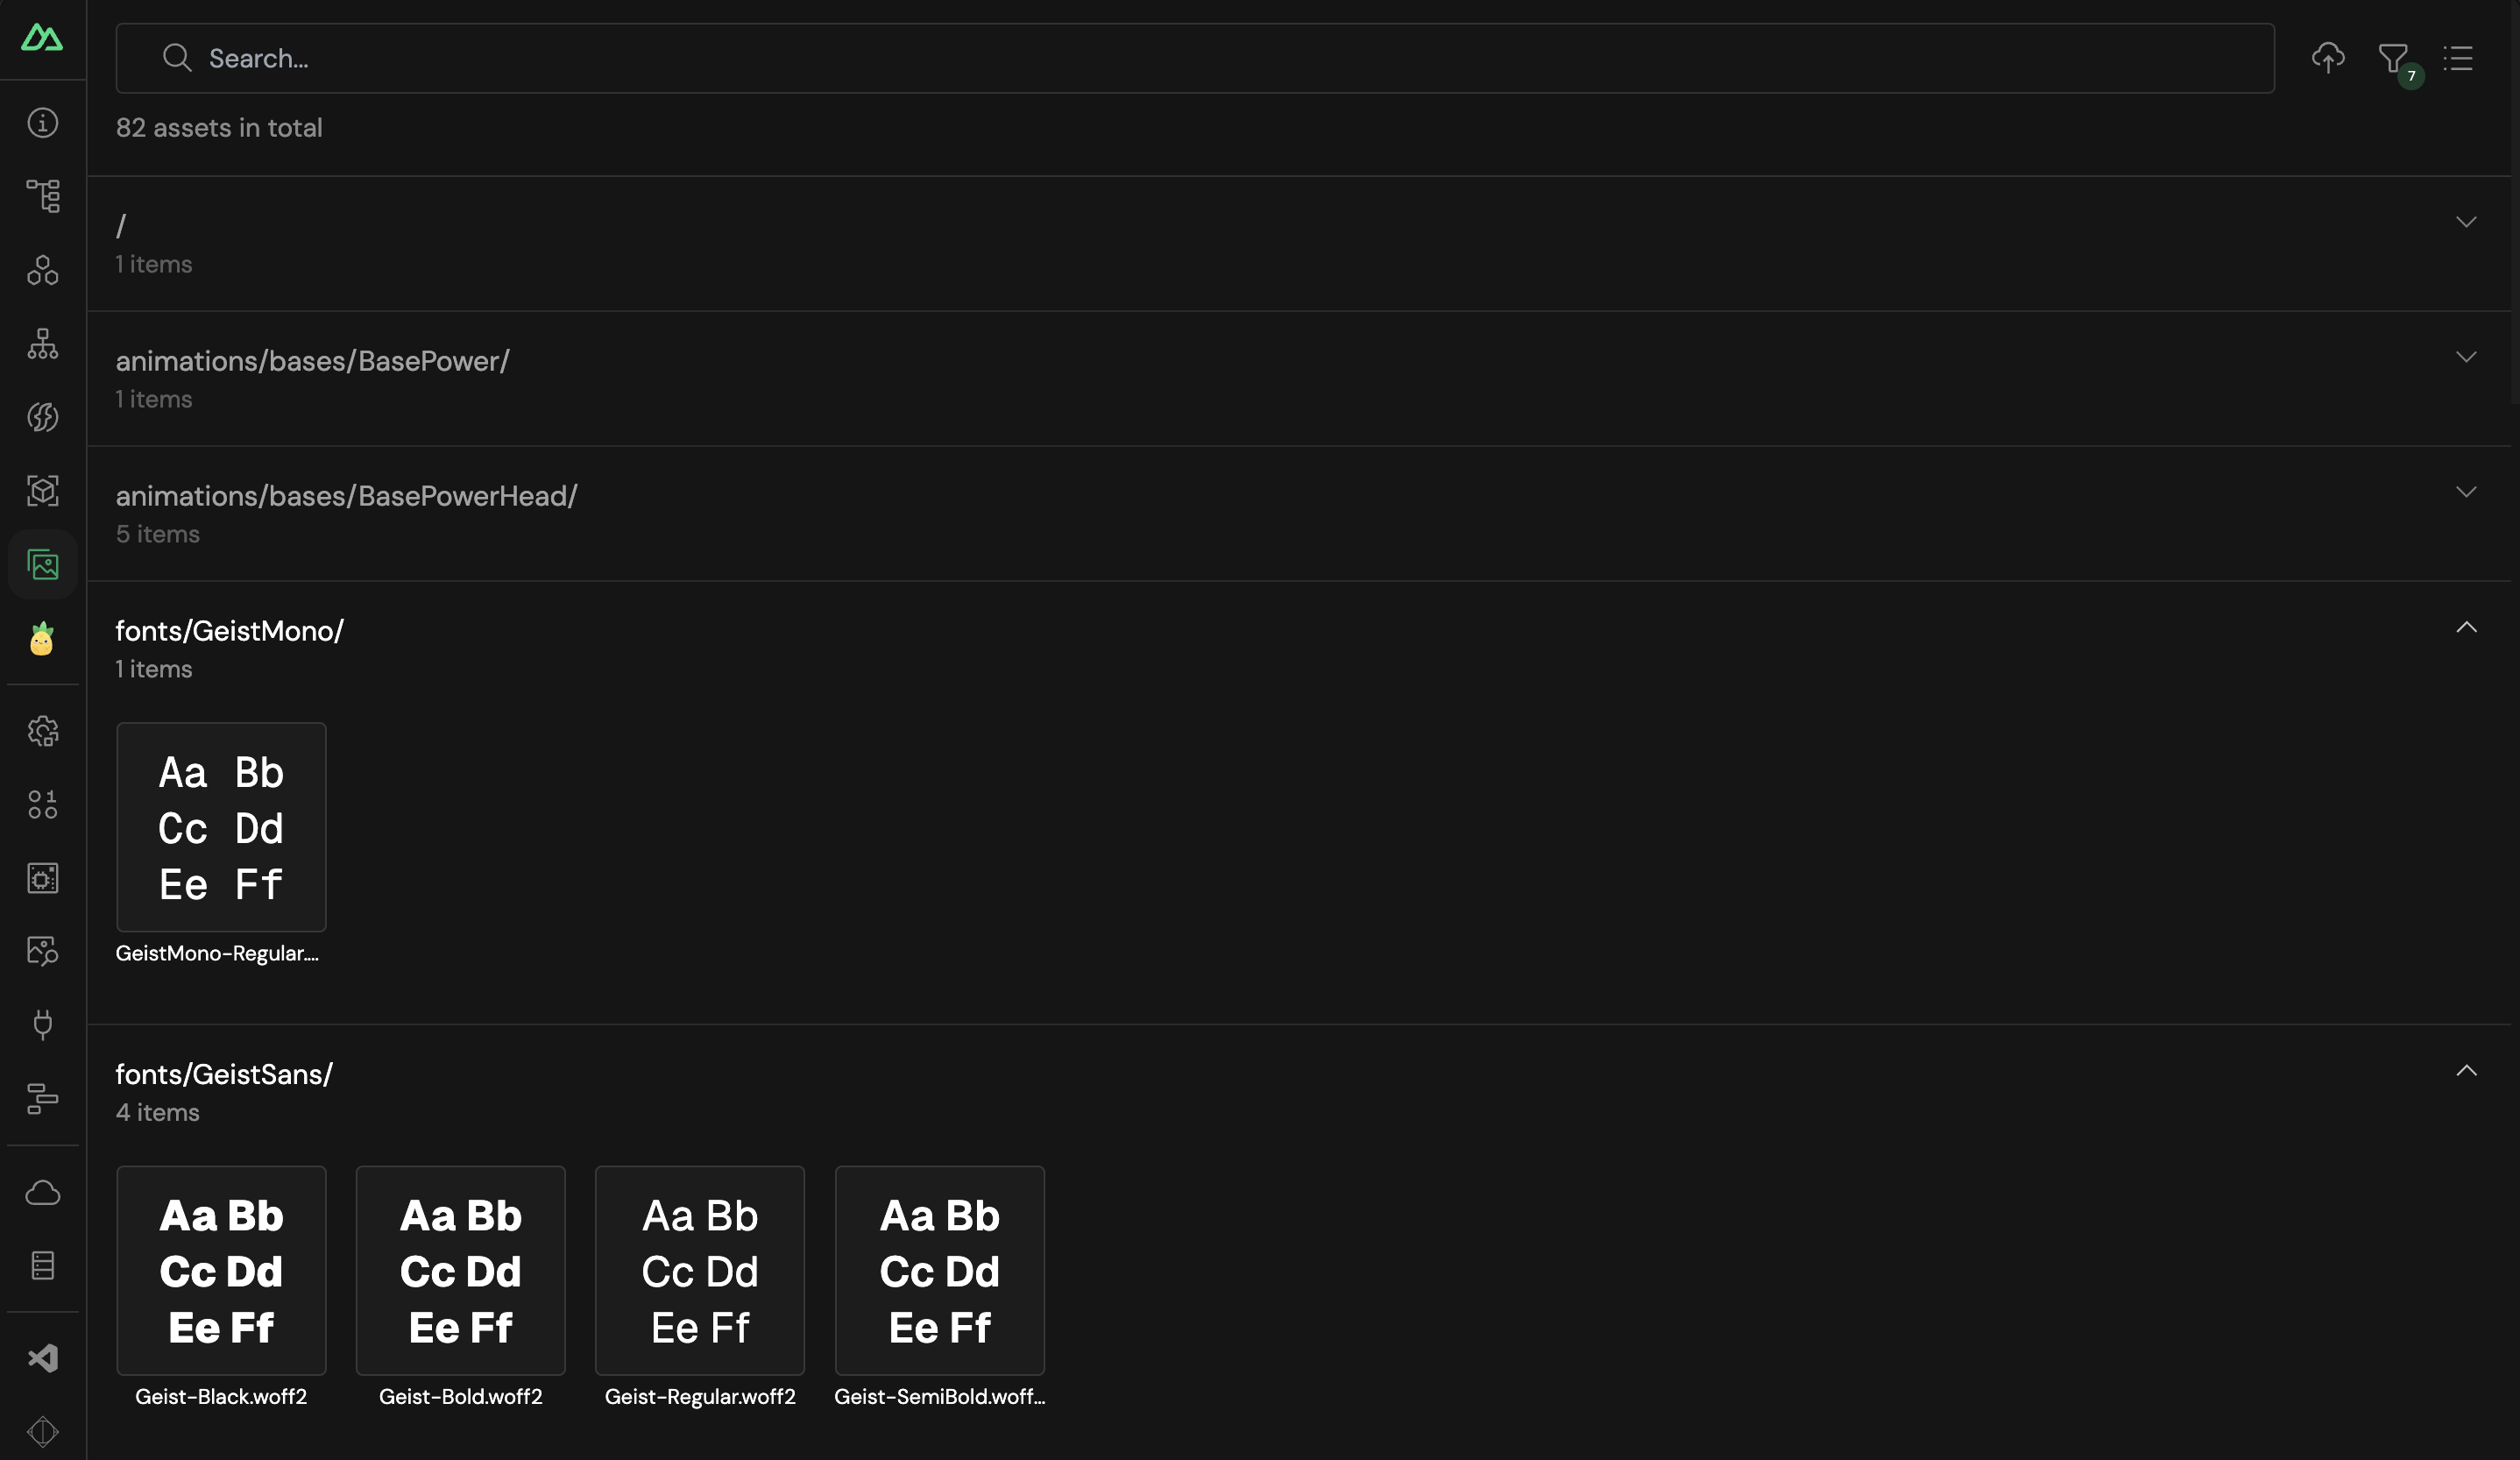
- See all the assets from your public directory. Click on a file to see a preview as well as other information.
- Drag and drop to upload an image directly from the DevTools and it will be added to your assets folder.
Feature #8: Runtime Configs
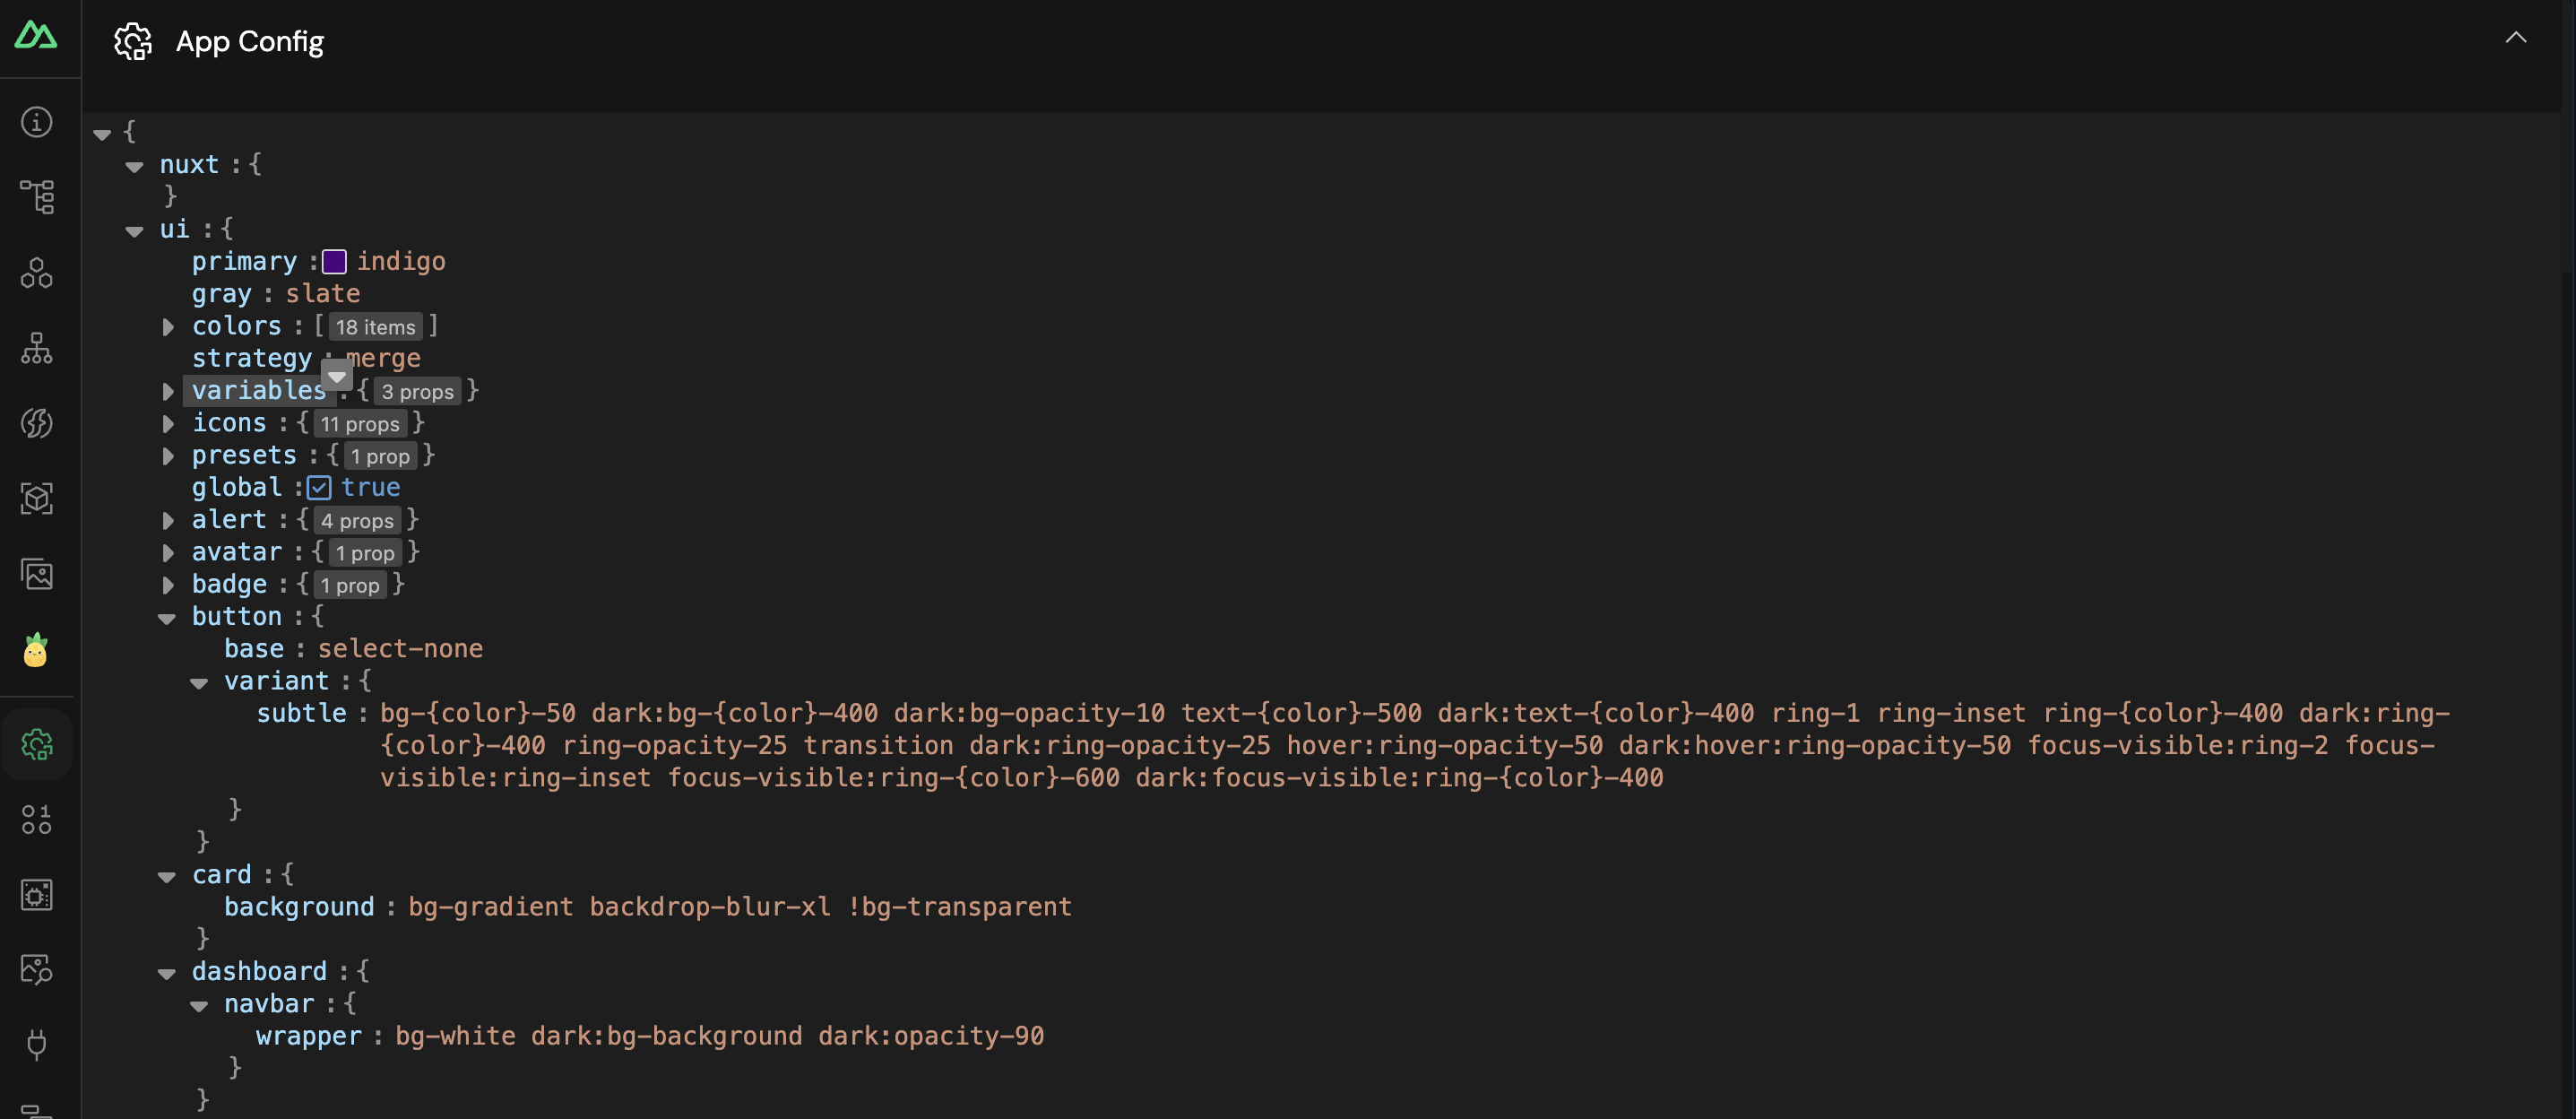
- Have an overview of your public runtime config and private runtime config.
- See how your app is behaving with different values and states. Update the color mode for instance and you should see the theme changing in real time.
- You can edit or add variables straight from this tab.
- See what has been injected by other libraries like Supabase.
Feature #9: Payload
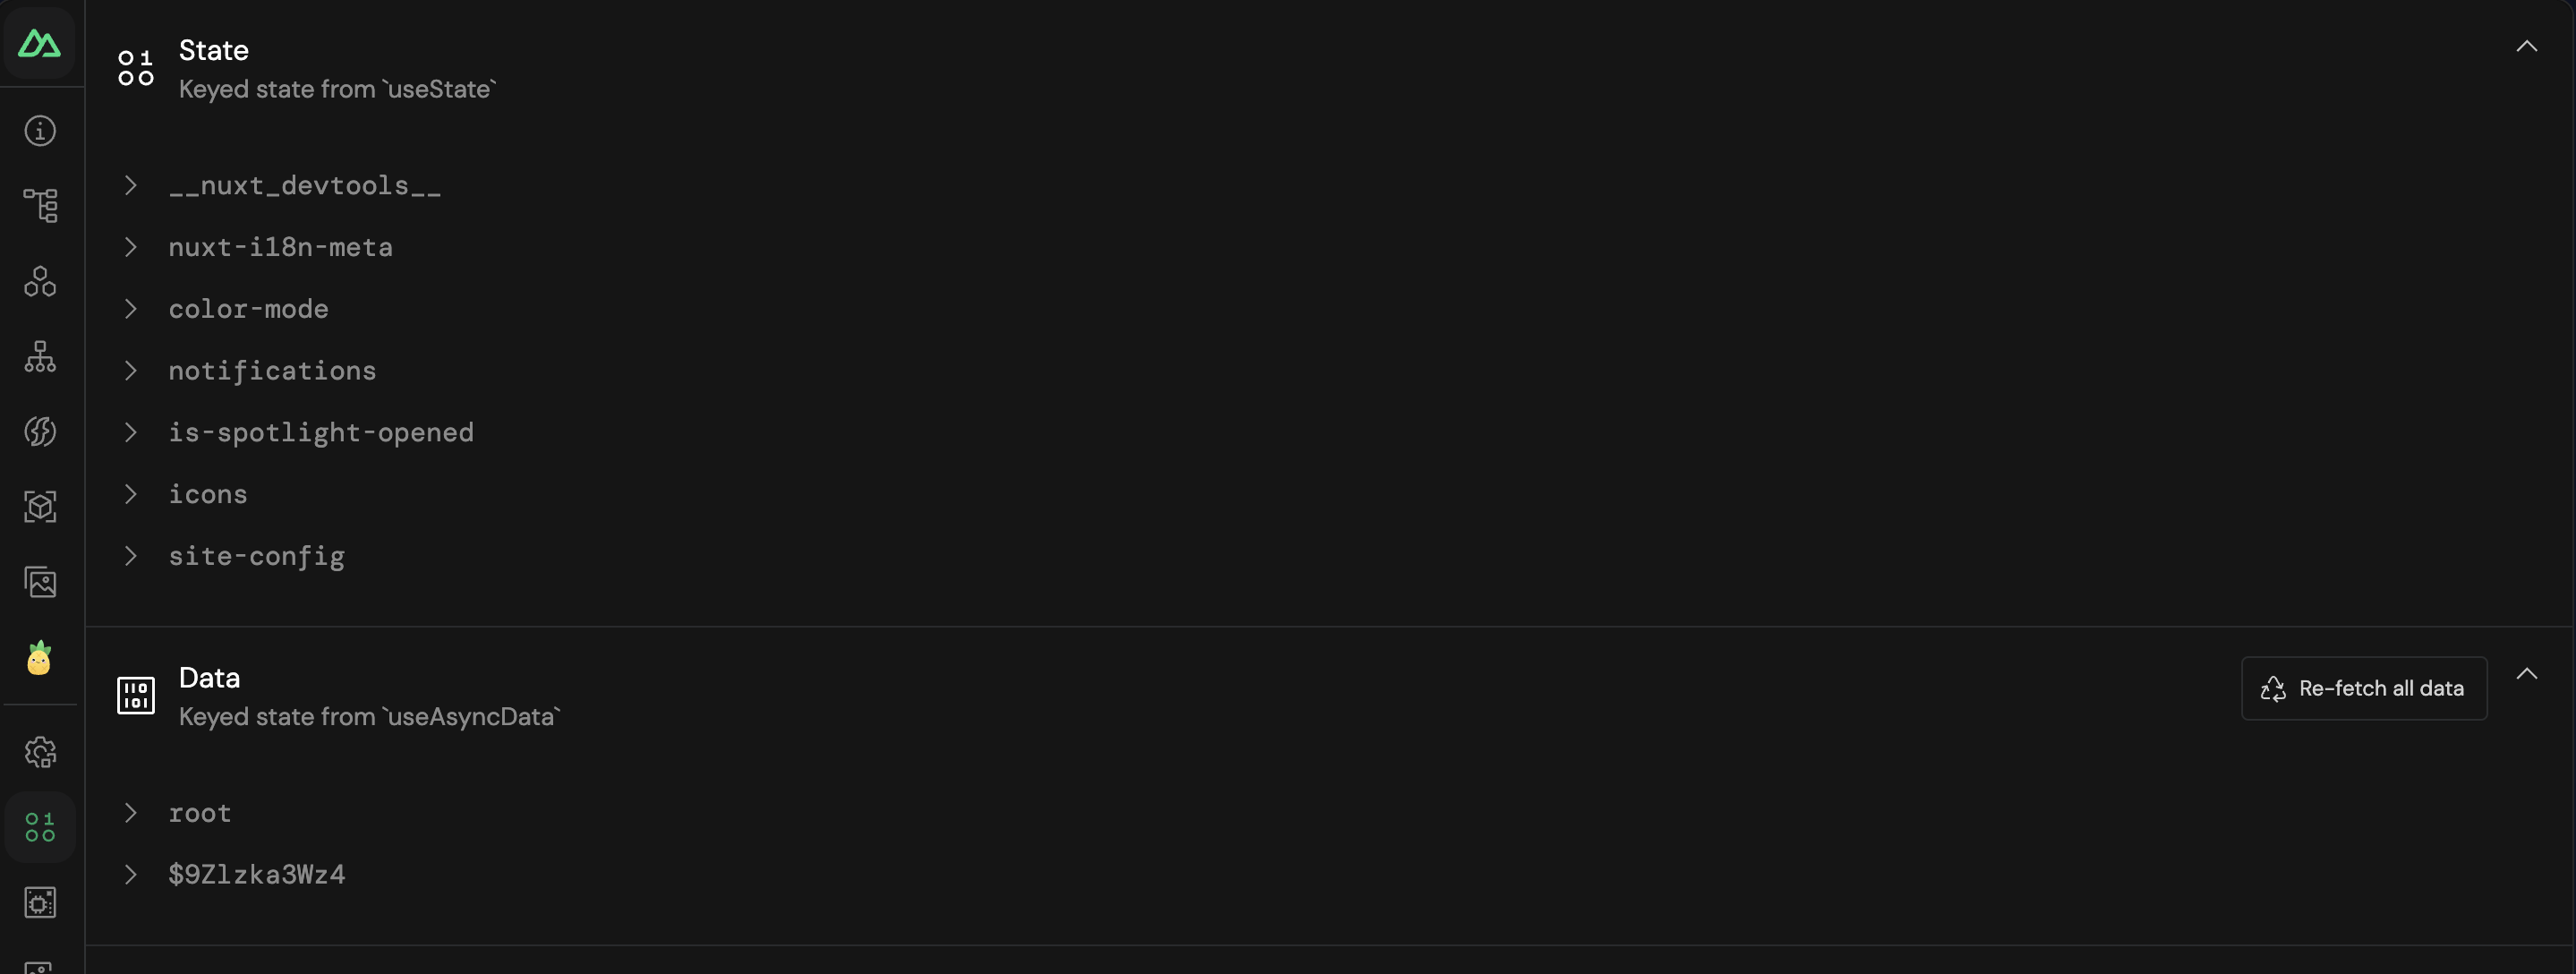
- Shows all the state and data payloads of your project. Keyed state from
useStateoruseAsyncData. - Edit the current state and data of your app. This makes it easy to see what you get from each API call or even see the locally stored data. See the result in real time as they are reactive. This will be easier to debug.
- Analyze the data of
useFetch.
Feature #10: Build & Analyze
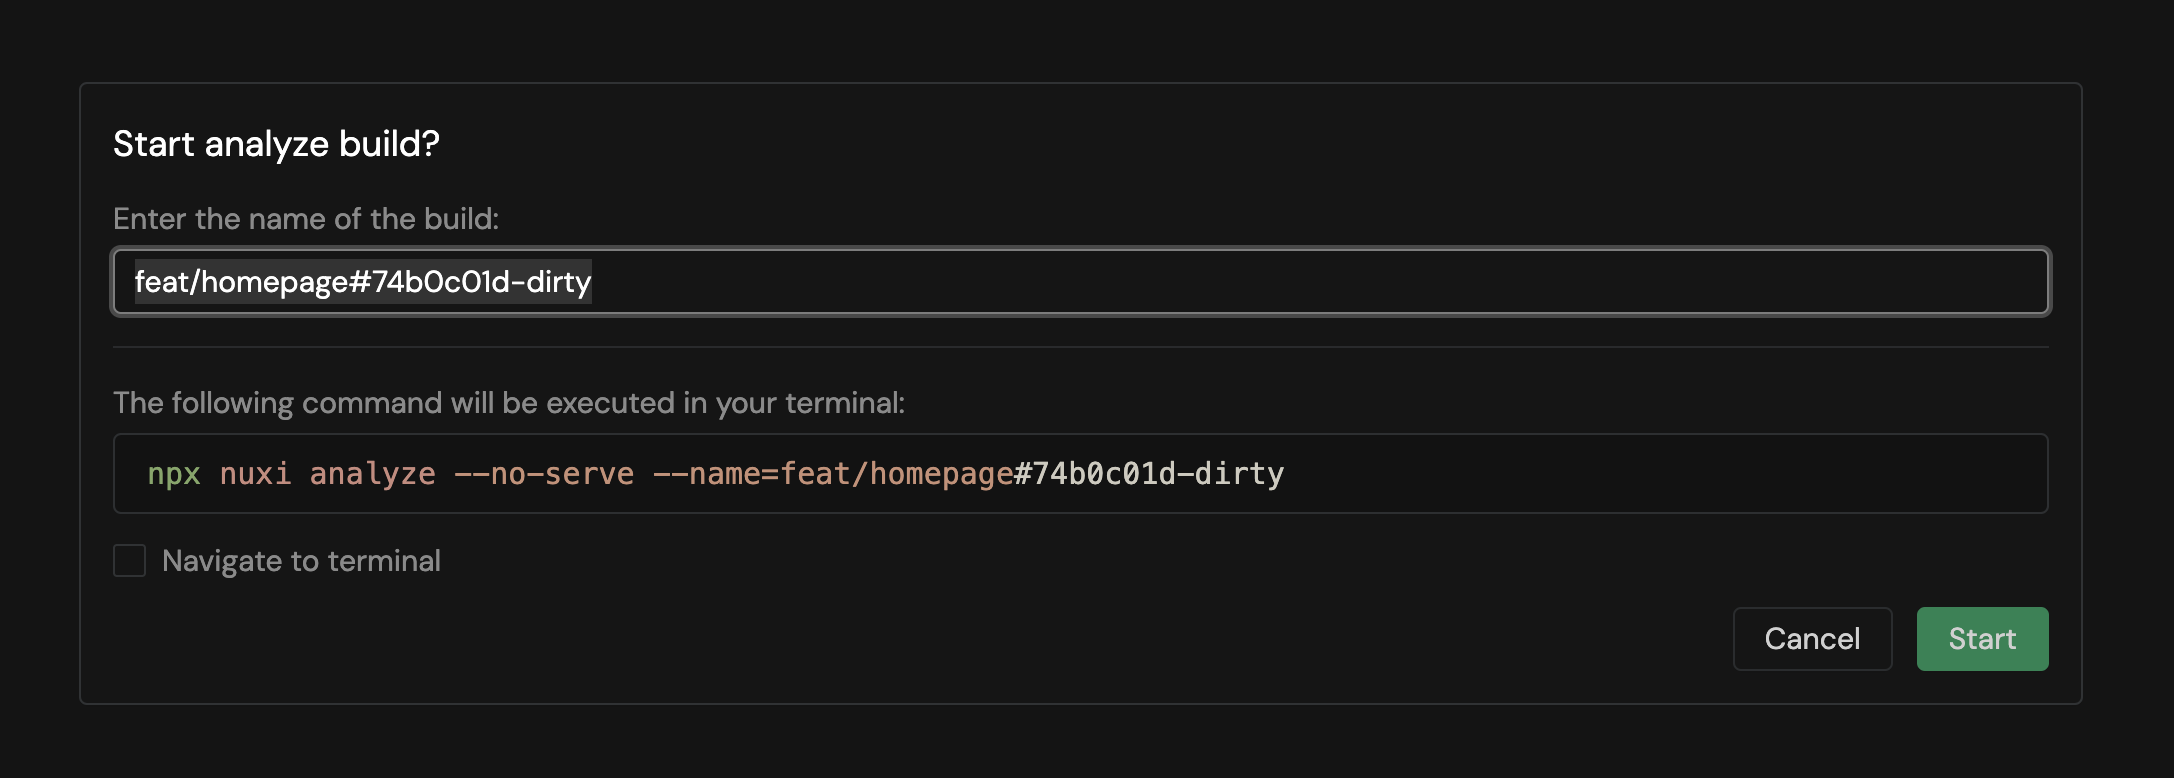
- Run “analyze build” and see the bundle size of your project.
- Saves the report so you can compare the bundle size in different builds.
- Inspect the size of the different parts of the bundle.
Feature #11: Open Graph
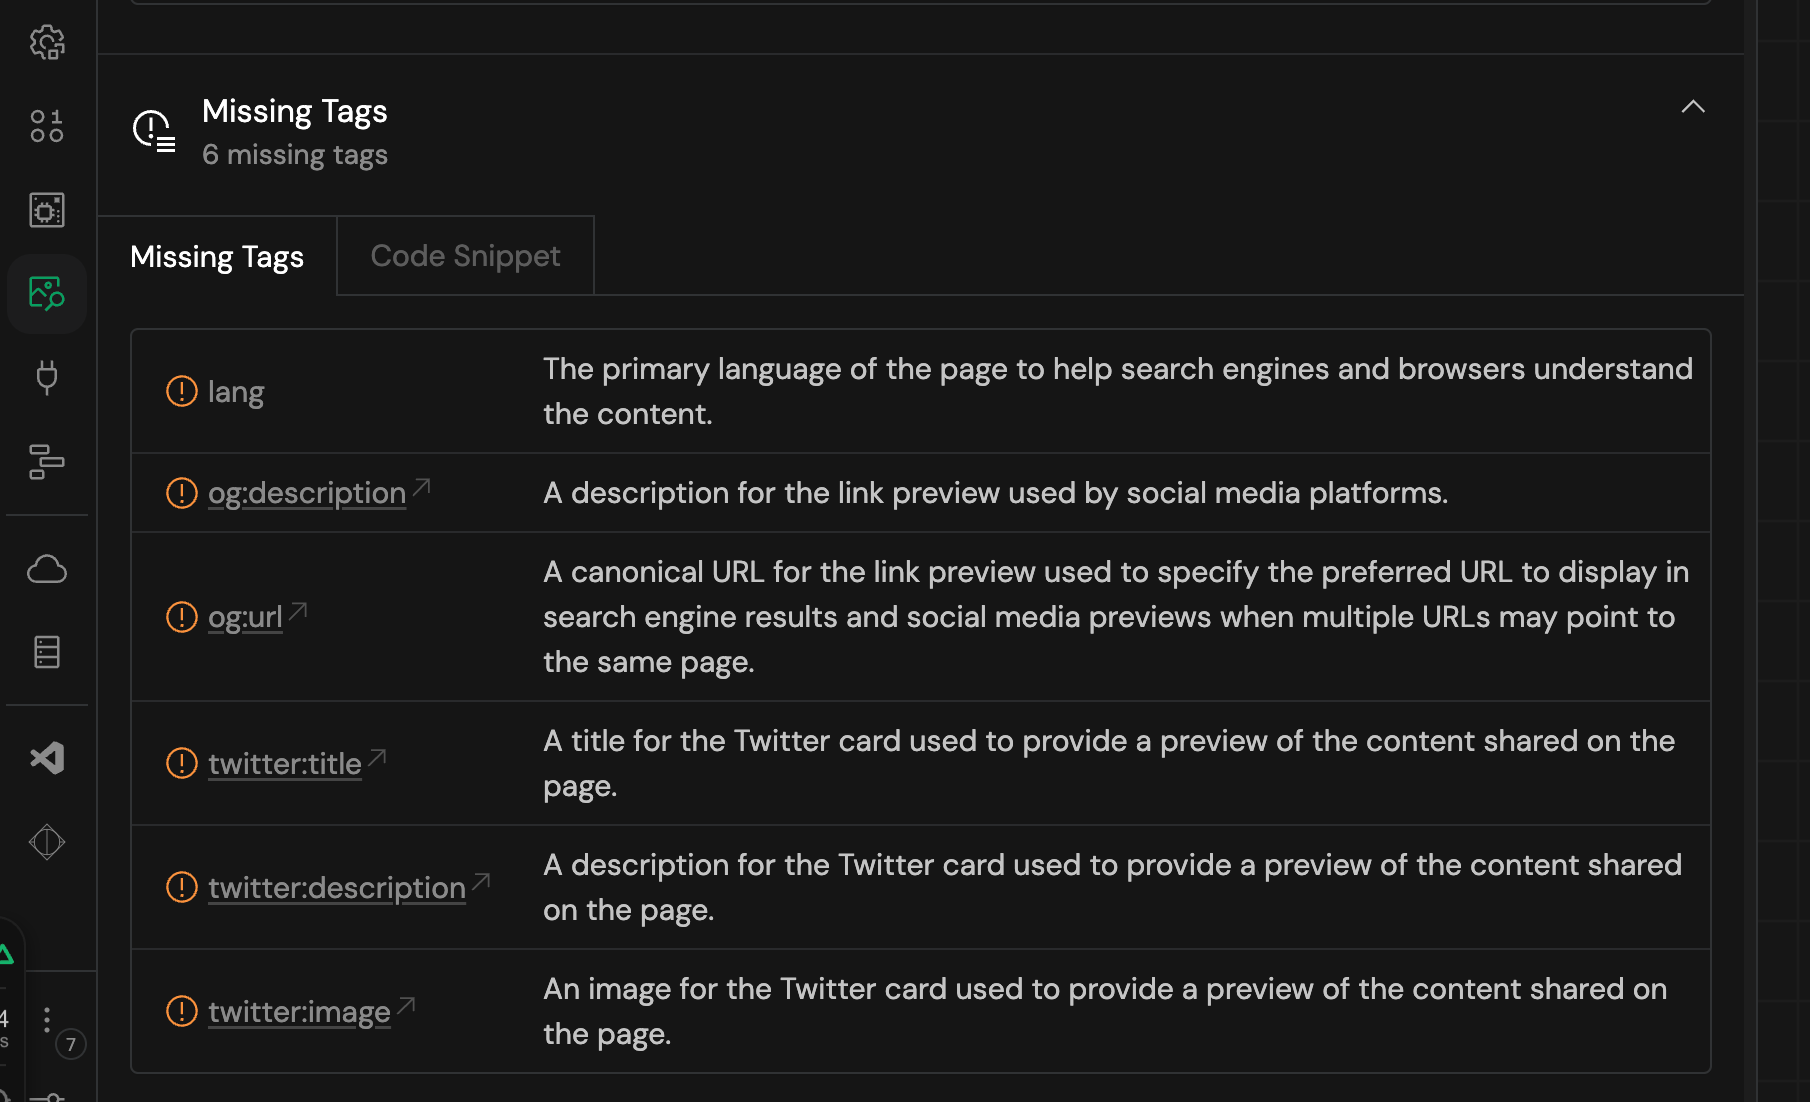
- Help you with SEO with a Social Preview Card for Twitter, Facebook and LinkedIn. See how it is going to render when shared on social media.
- Provides missing SEO tags with the ability to copy code snippets.
Feature #12: Server Routes
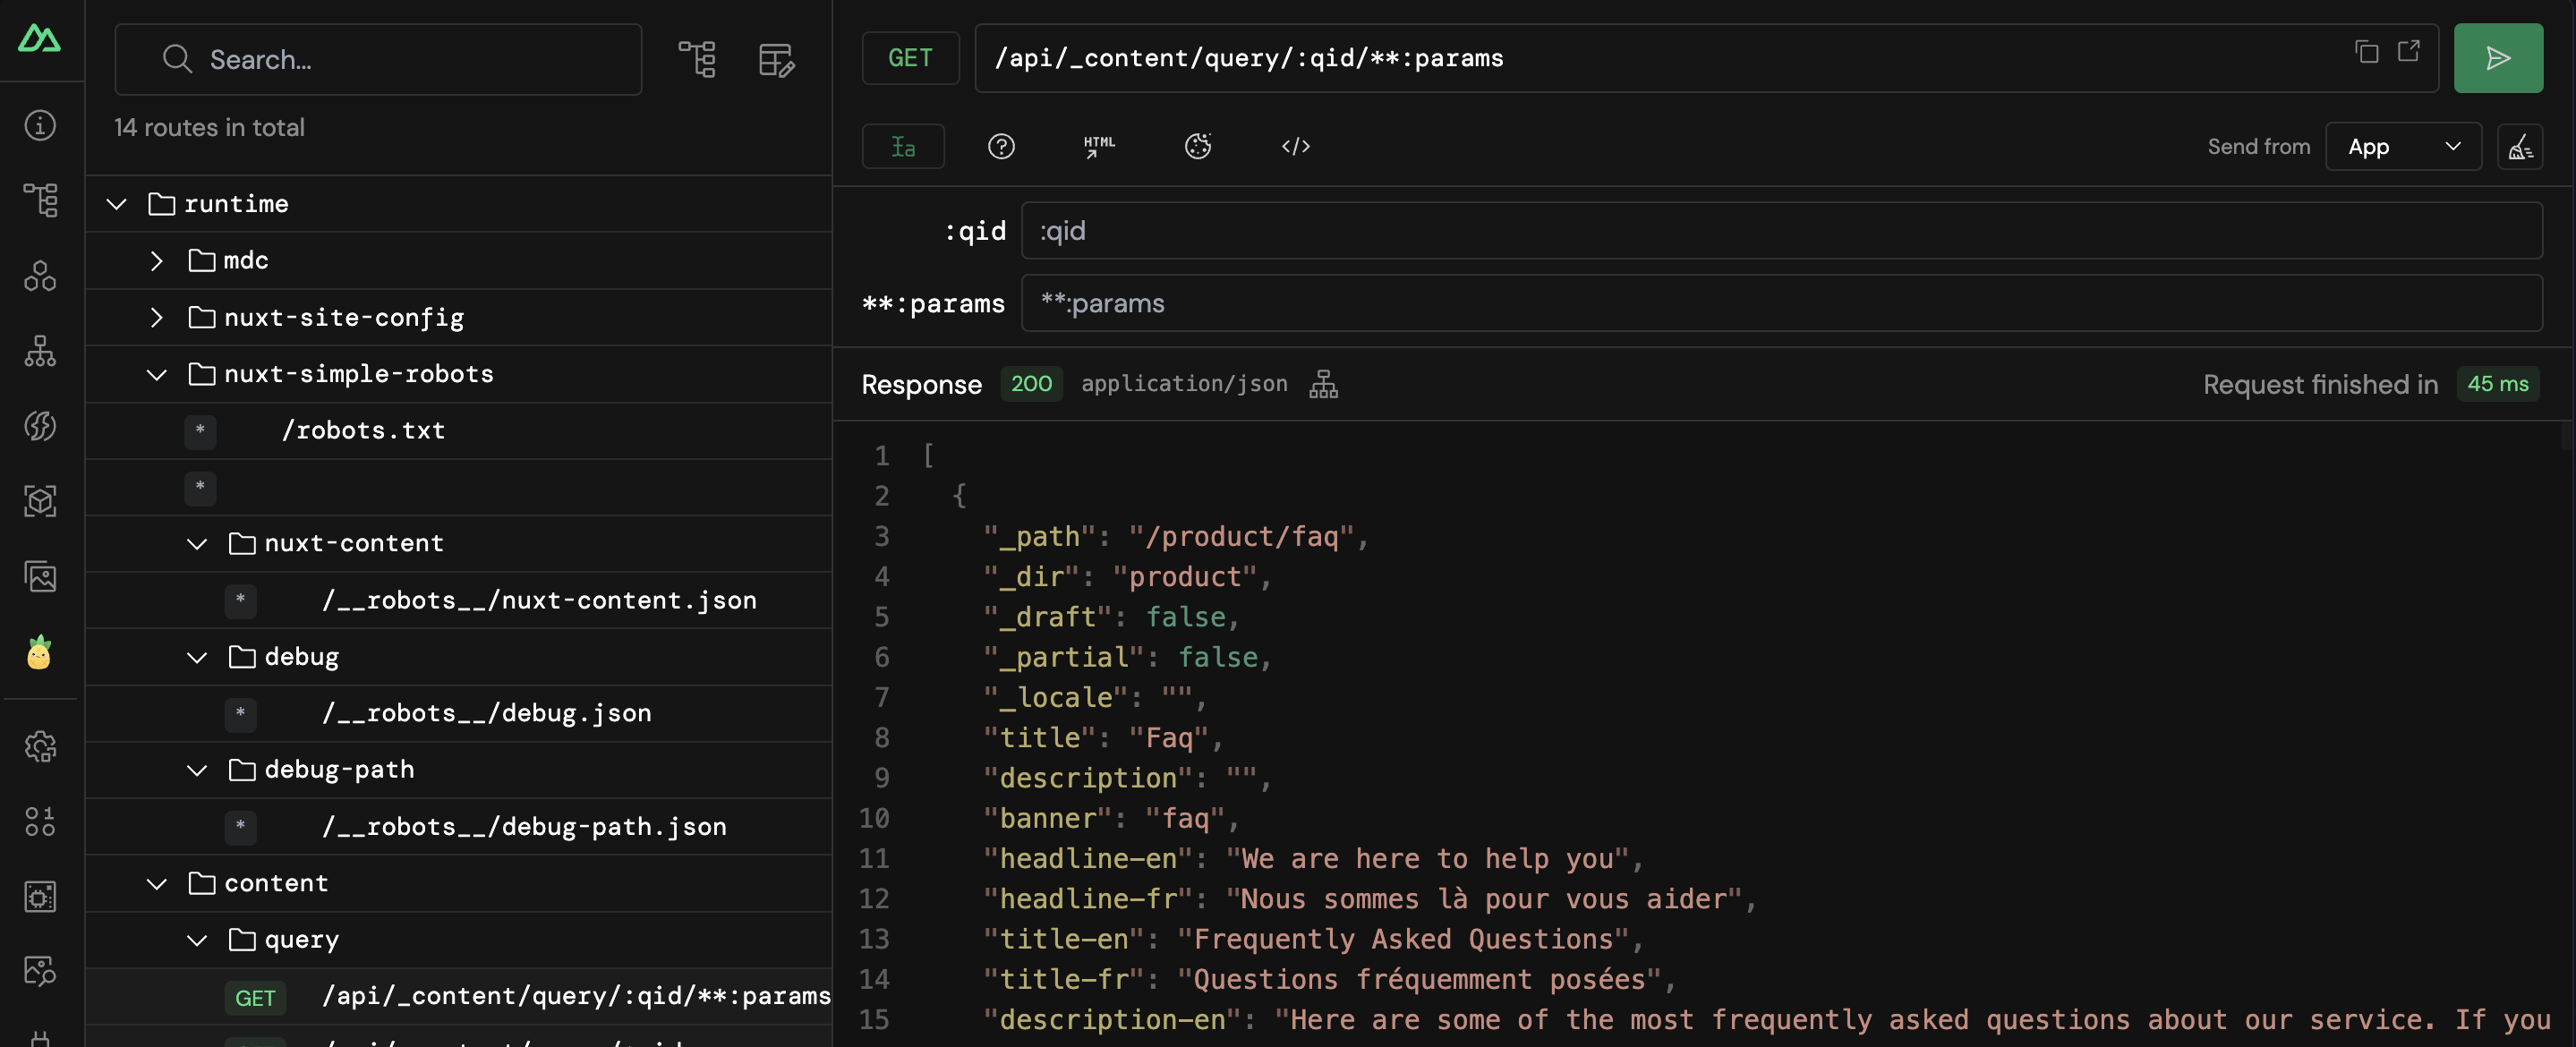
- Shows all Nitro routes in your project. ♀️
- Provides a playground to send and test your endpoints.
Feature #13: Storage
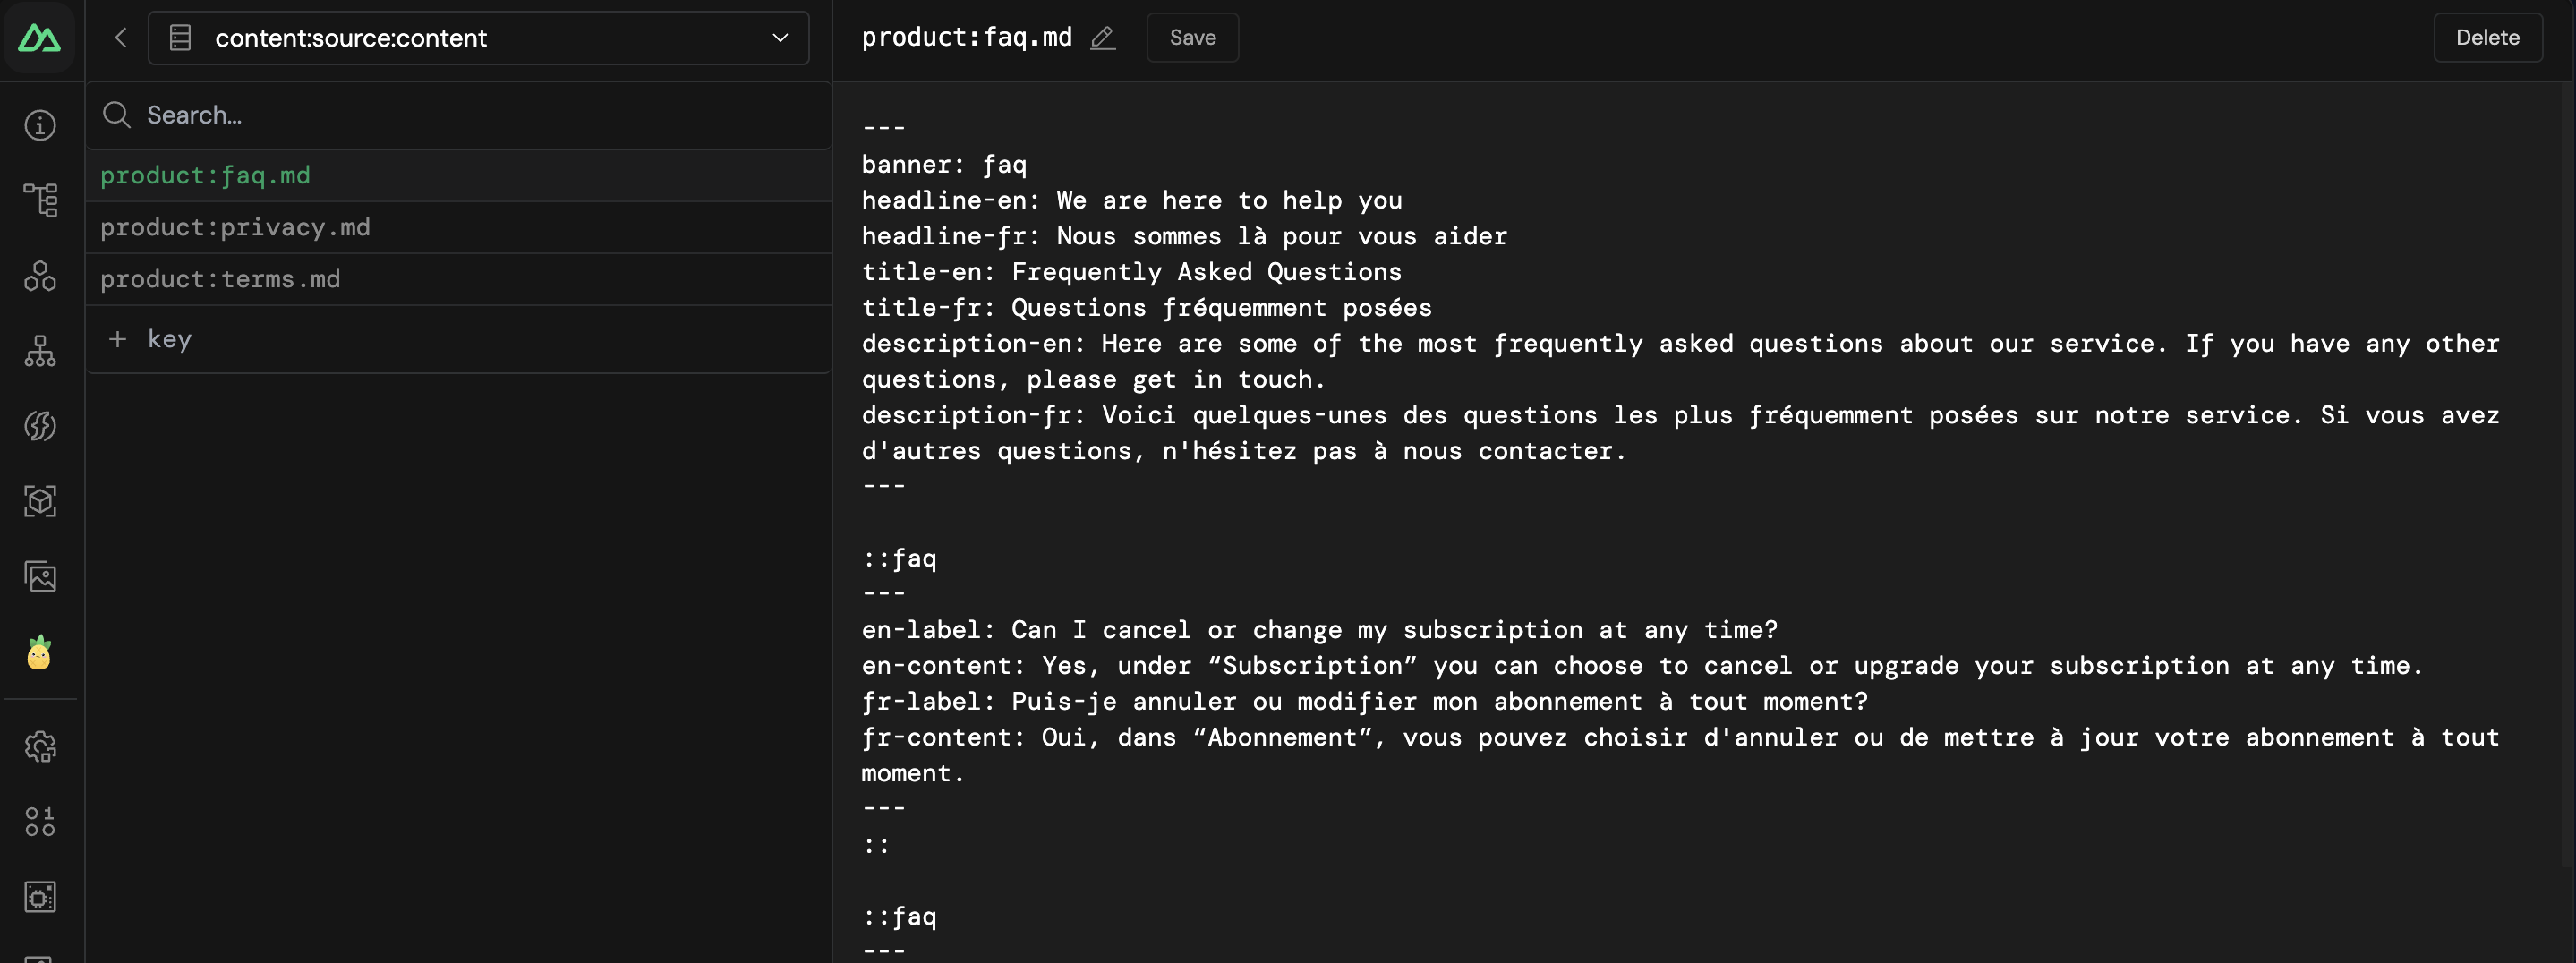
- Shows all the Nitro storage in your project.
- Create, edit and delete files (for instance the markdown files you are using for Nuxt Content).
Feature #14: Hooks
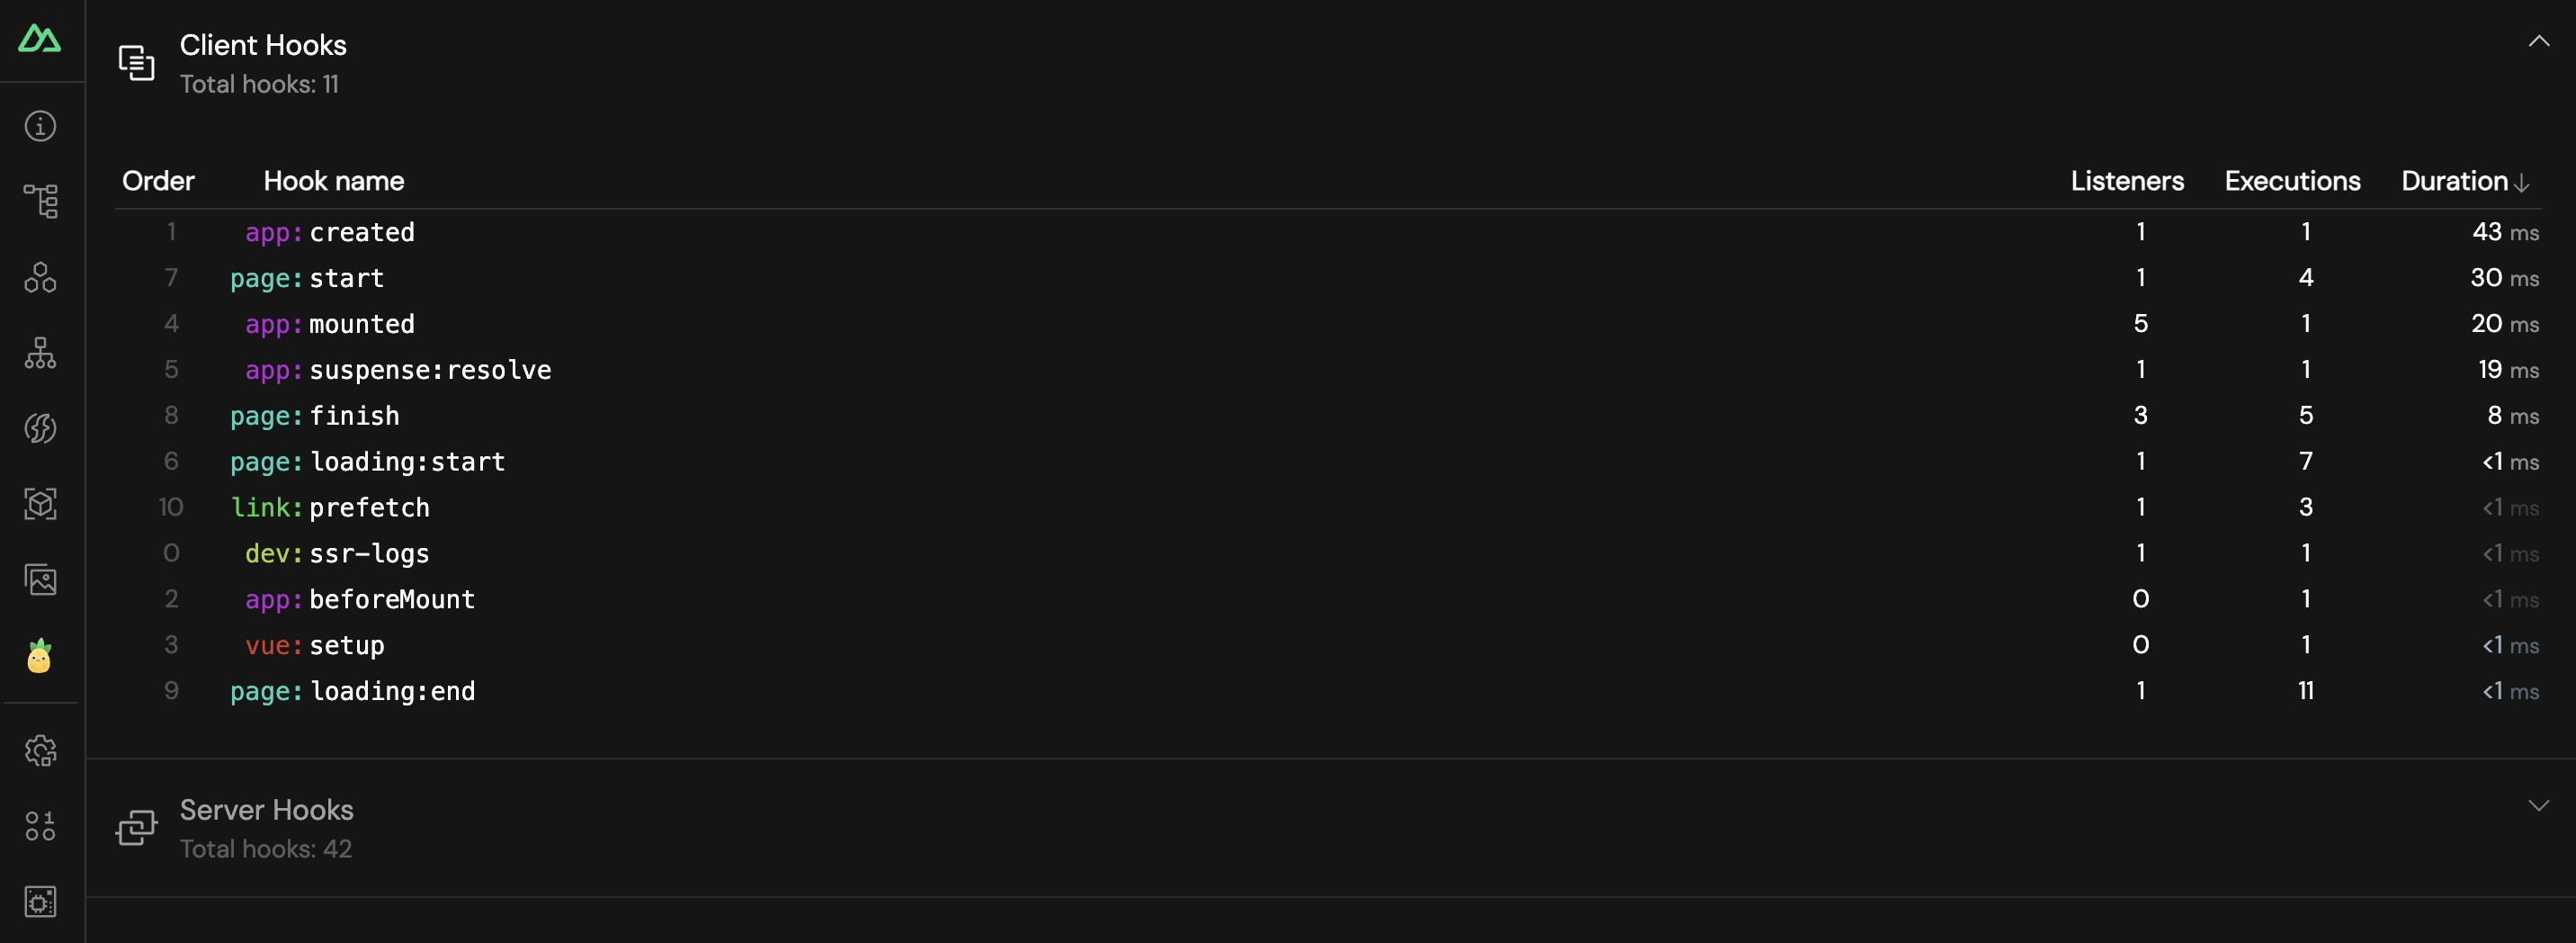
- Gives you an overview of all hooks and lifecycles in order. This can be very useful for testing performance and monitoring.
- See at which point your app is behaving slowly and where the bottleneck is.
Feature #15: Virtual Files
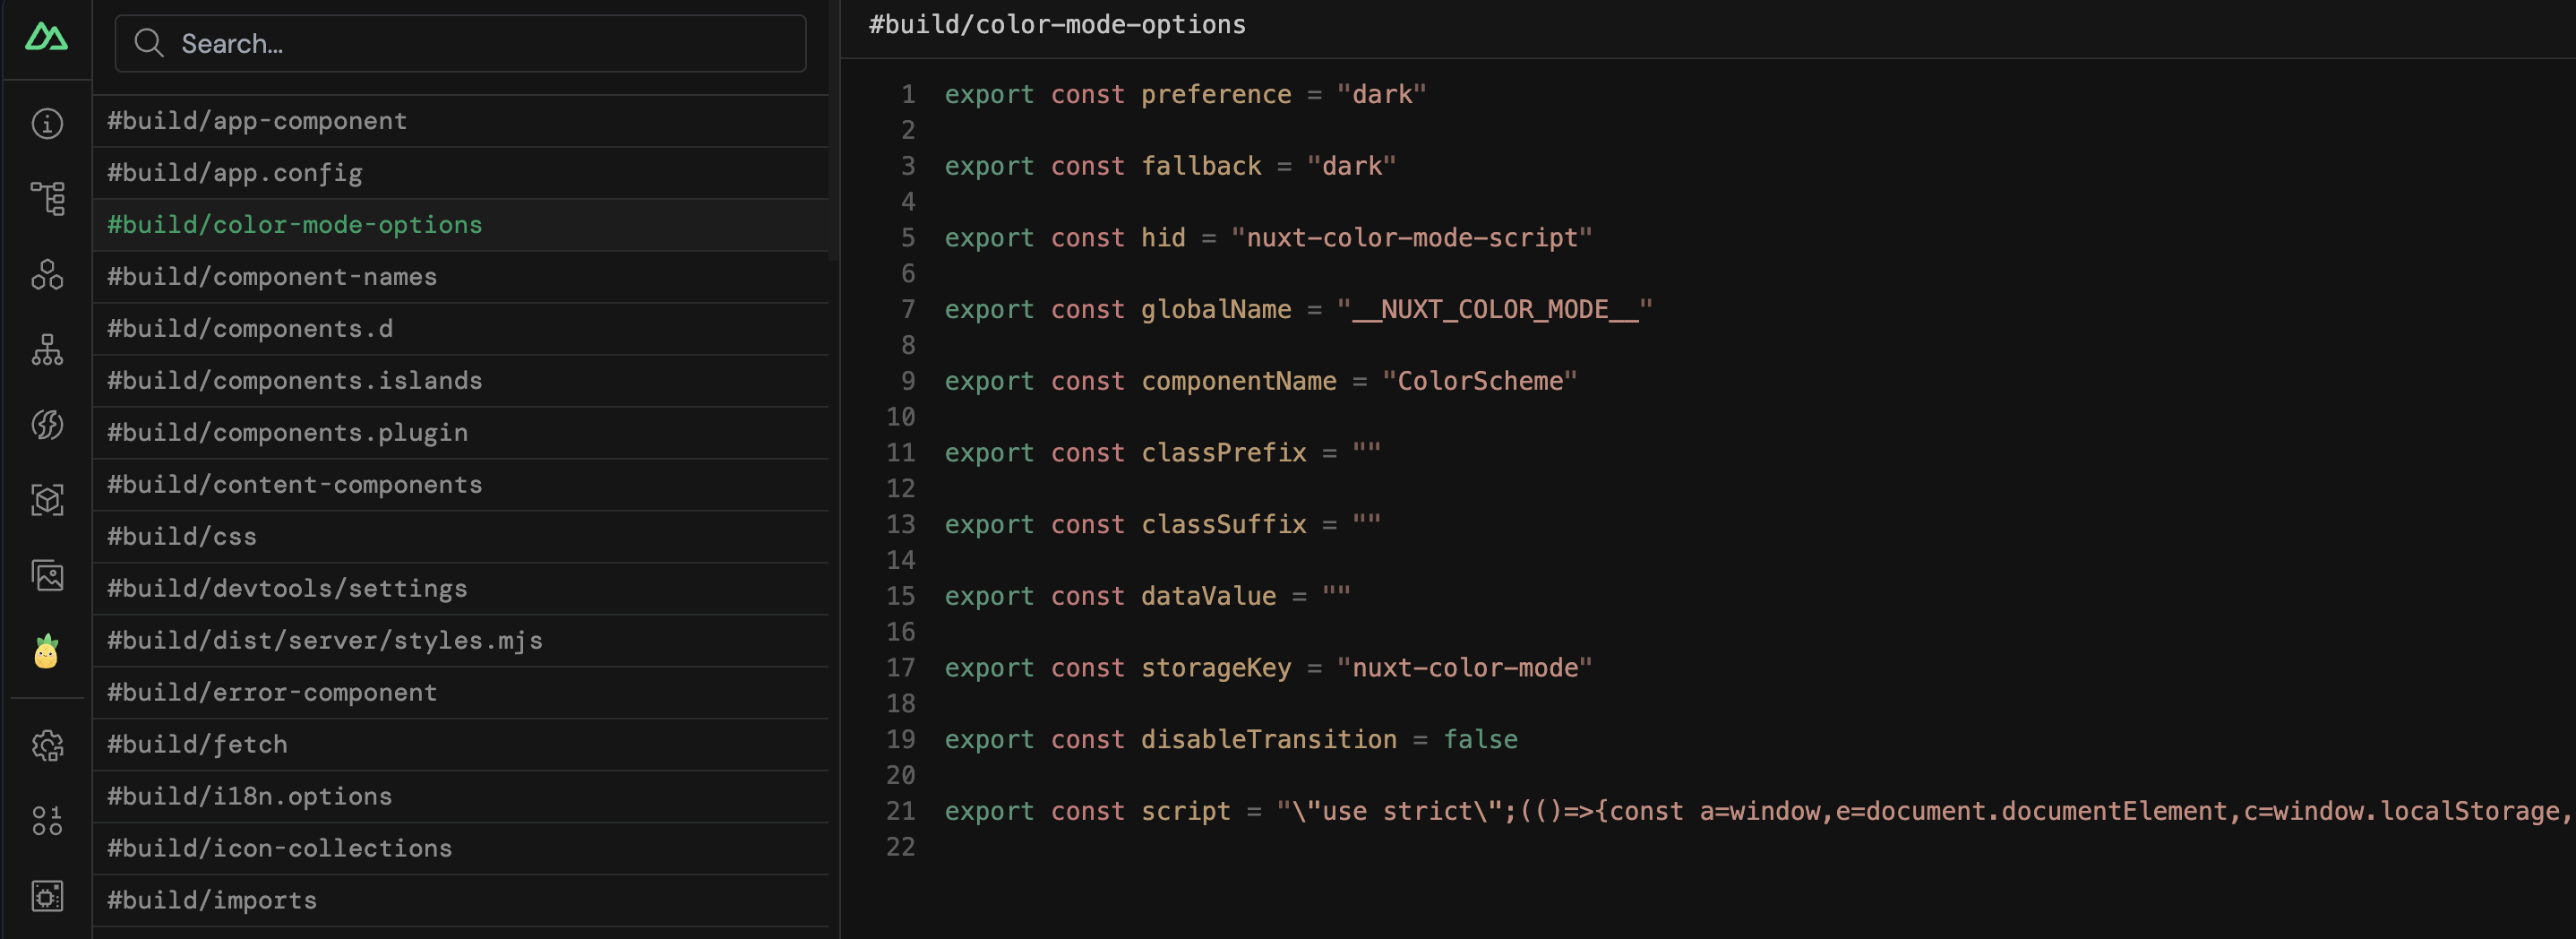
- Shows the virtual files generated by Nuxt to support the conventions.
- See what Nuxt is doing under the hood.
- Useful for advanced debugging and developers who want to contribute to their virtual modules.
Feature #16: Inspect
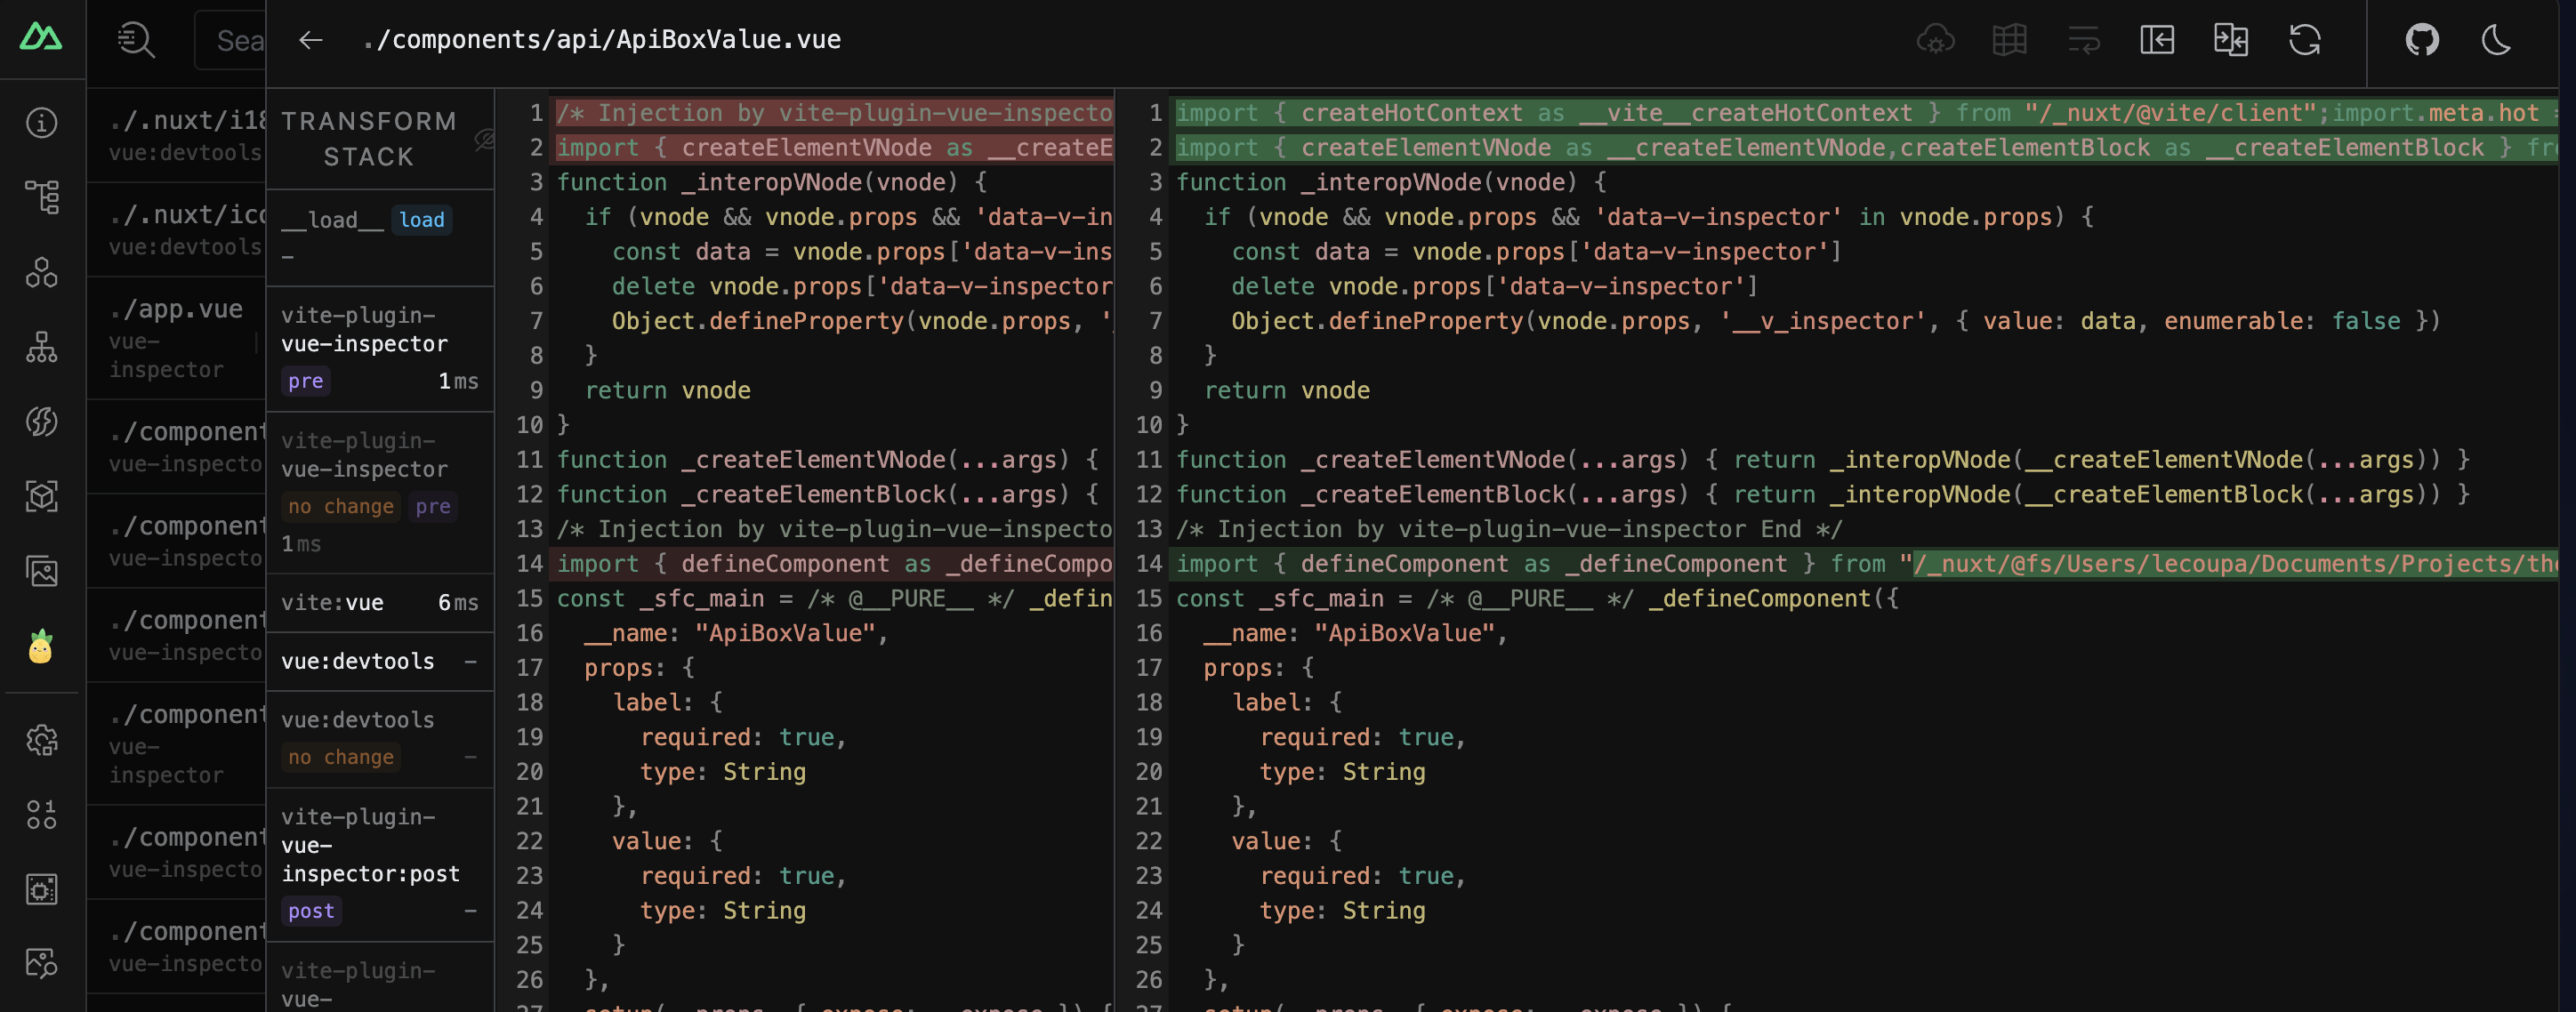
- Inspect and expose the
vite-plugin-inspectintegration, allowing you to inspect the transformation steps of Vite. - See the transformation steps that Nuxt and Vue are doing to your code and better understand the internals of these two frameworks. Or even a module to spot an issue.
- Useful to create some plugins or to debug
Feature #17: Third-Party Features

Module and integration can contribute to their features in the DevTools. And believe me, the Vue ecosystem is fantastic. Here are a few features that will be added to your DevTools when you install a specific module.
- Pinia playground
- Nuxt EdgeDB (custom tab file from GitHub)
- VueUse Docs into Nuxt DevTools
- Vitest to run the test directly from the DevTools
- Inject VS Code into the DevTools (but this is still experimental)
- OG image previews
If you want to add your features to the DevTools, you just have to embed your iframe. This can be very useful for your team to have a custom feature that is specific to your project or a specific package.
- Add your own modules integration to the Nuxt DevTools.
- Utility kit for easier DevTools integrations.
- UI Kit is for module authors to build a custom view.
Feature #18: Settings
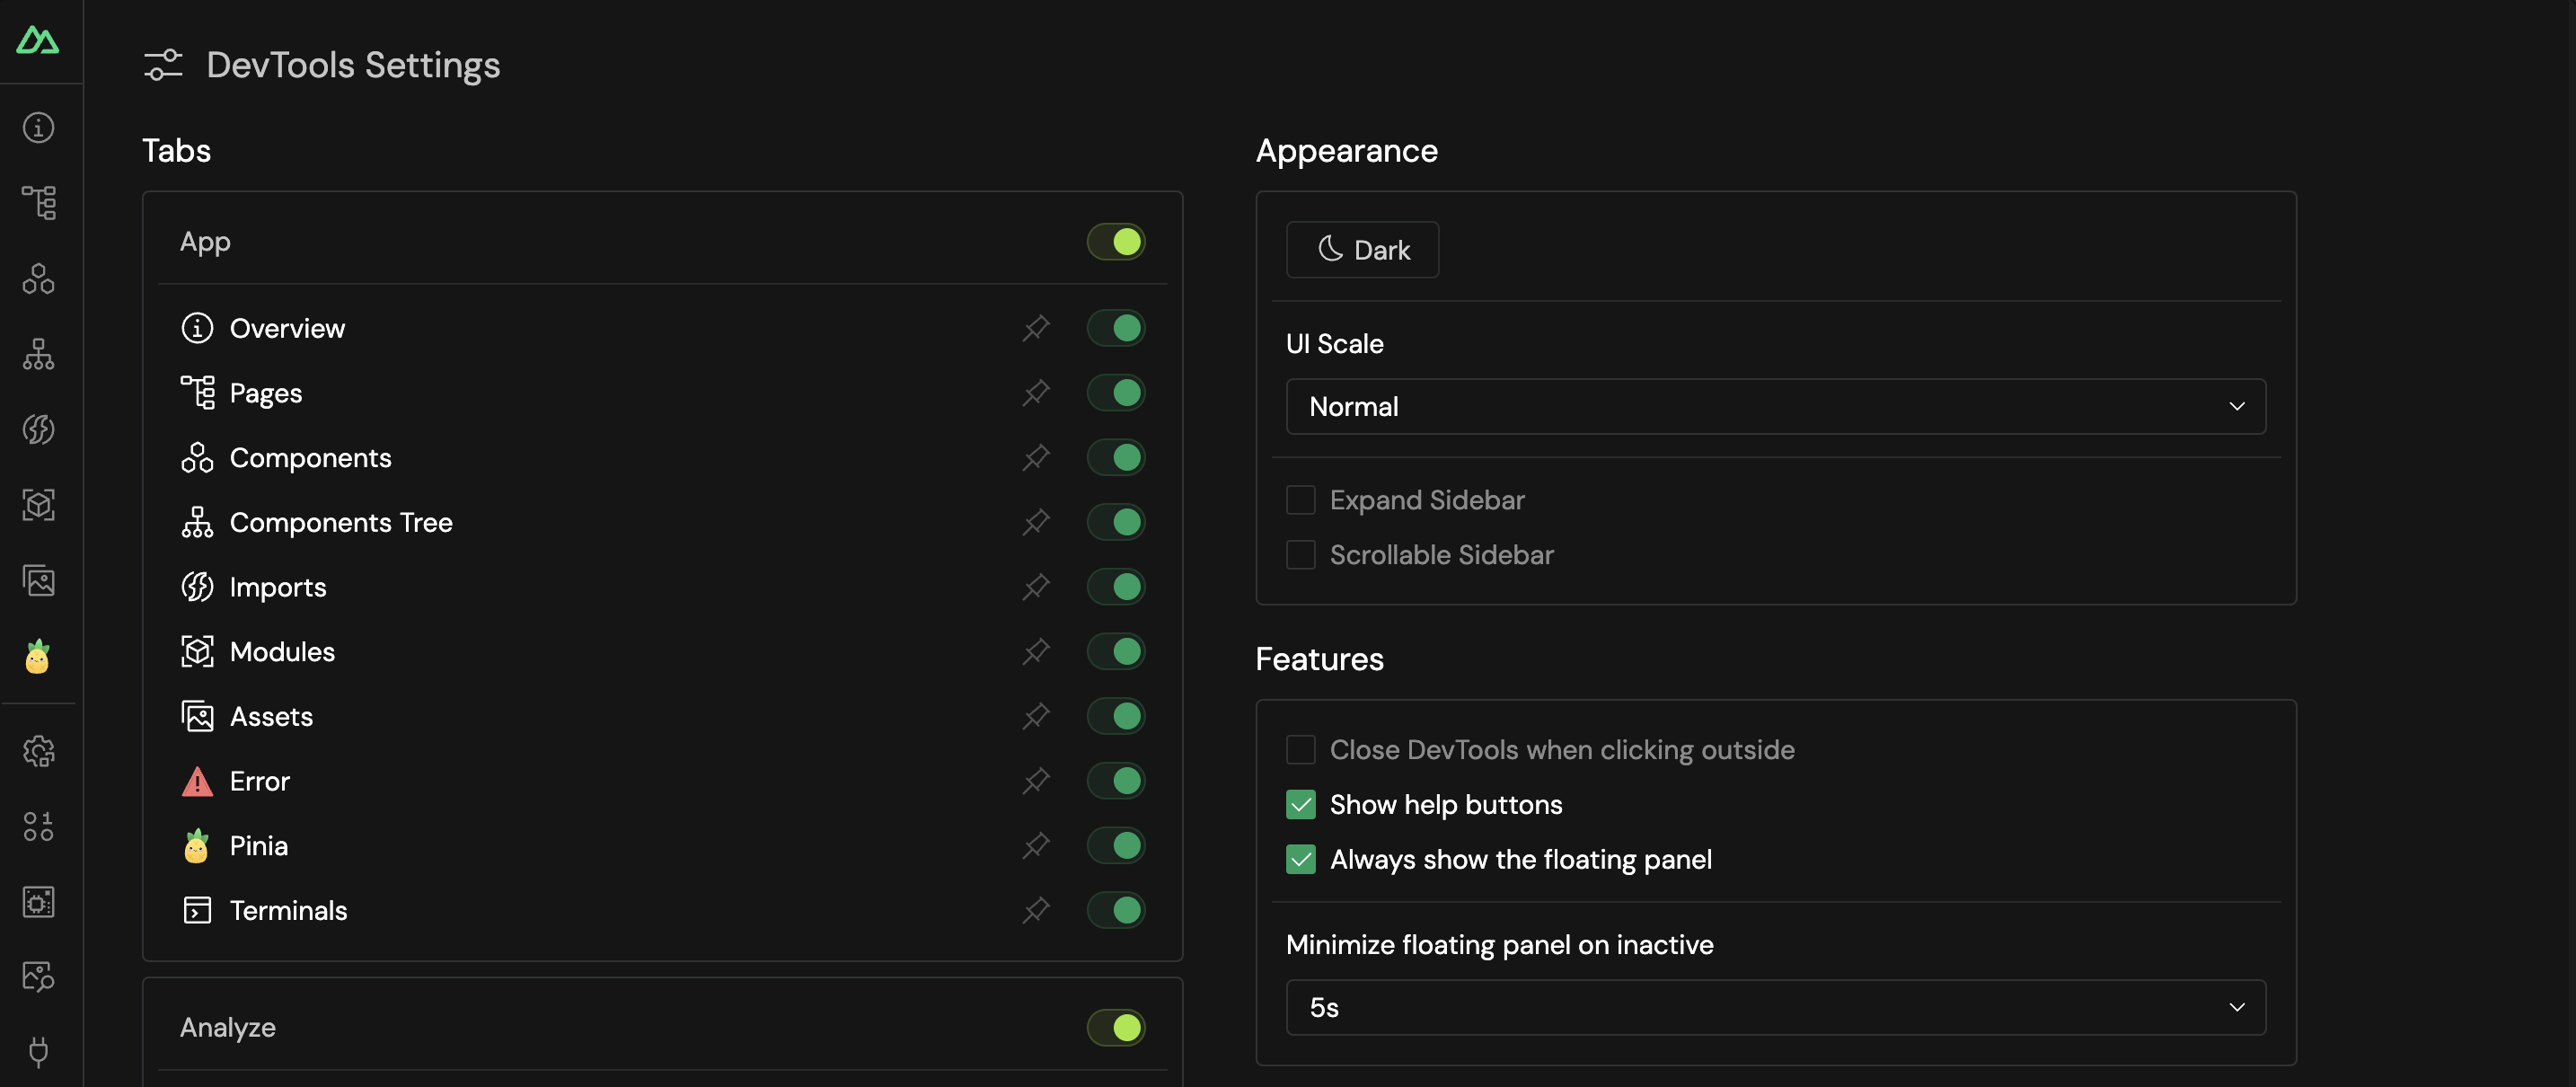
- The Settings tab allows you to configure the DevTools to your needs.
- Hide tabs, change tab order, scale, change the theme, toggle help buttons and more. Feel free to dig!
Conclusion
Nuxt DevTools are constantly evolving. For instance, a feature to improve the accessibility of our apps is in the works.
Of course, some people don’t like the DevTools and they will tell you should master your VS Code and browser debugger instead. In my opinion, they are right and wrong and it’s a complementary tool that can be useful in a lot of situations. On the other hand, it’s best to use it globally so your team is not forced to use it (see the part about the installation).
I also have some coworkers who told me it was making things slower for them and not everyone has the latest MacBook so your environment should be as light as possible. ♀️
Other than that, I hope you will enjoy the Nuxt DevTools as much as I do. It’s a great tool to have in your toolbox and I hope you will be able to use it to its full potential.
You can reach me on Twitter @RifkiNada. And in case you are curious about my work or other articles, you can look at them here www.nadarifki.com.
Thank you for reading!
This content originally appeared on Telerik Blogs and was authored by Nada Rifki
Nada Rifki | Sciencx (2024-09-17T09:23:02+00:00) Vue Basics: Deep Dive into Nuxt DevTools. Retrieved from https://www.scien.cx/2024/09/17/vue-basics-deep-dive-into-nuxt-devtools/
Please log in to upload a file.
There are no updates yet.
Click the Upload button above to add an update.
