
This content originally appeared on HackerNoon and was authored by Alexander Sharov
Recently, I encountered a task where a business was using AWS Elastic Beanstalk but was struggling to understand the system state due to the lack of comprehensive metrics in CloudWatch. By default, CloudWatch only provides a few basic metrics such as CPU and Networks. However, it’s worth noting that Memory and Disk metrics are not included in the default metric collection.
\ Fortunately, each Elastic Beanstalk virtual machine (VM) comes with a CloudWatch agent that can be easily configured to collect additional metrics. For example, if you need information about VM memory consumption, which AWS does not provide out of the box, you can configure the CloudWatch agent to collect this data. This can greatly enhance your visibility into the performance and health of your Elastic Beanstalk environment, allowing you to make informed decisions and optimize your application’s performance.
How To Configure Custom Metrics in AWS Elastic Beanstalk
To accomplish this, you’ll need to edit your Elastic Beanstalk zip bundle and include a cloudwatch.config file in the .ebextensions folder at the top of your bundle. Please note that the configuration file should be chosen based on your operating system, as described in this article. By doing so, you’ll be able to customize the CloudWatch agent settings and enable the collection of additional metrics, such as memory consumption, to gain deeper insights into your Elastic Beanstalk environment. This will allow you to effectively monitor and optimize the performance of your application on AWS.
\ Linux-Based Config:
\
files:
  "/opt/aws/amazon-cloudwatch-agent/bin/config.json":
    mode: "000600"
    owner: root
    group: root
    content: |
      {
        "agent": {
          "metrics_collection_interval": 60,
          "run_as_user": "root"
        },
        "metrics": {
          "append_dimensions": {
            "InstanceId": "$${aws:InstanceId}"
          },
          "metrics_collected": {
            "mem": {
              "measurement": [
                "mem_total",
                "mem_available",
                "mem_used",
                "mem_free",
                "mem_used_percent"
              ]
            }
          }
        }
      }
container_commands:
  apply_config_metrics:
    command: /opt/aws/amazon-cloudwatch-agent/bin/amazon-cloudwatch-agent-ctl -a fetch-config -m ec2 -s -c file:/opt/aws/amazon-cloudwatch-agent/bin/config.json
\ Windows-Based Config:
\
files:
  "C:\\Program Files\\Amazon\\AmazonCloudWatchAgent\\cw-memory-config.json":
    content: |
{
        "agent": {
          "metrics_collection_interval": 60,
          "run_as_user": "root"
        },
        "metrics": {
          "append_dimensions": {
            "InstanceId": "$${aws:InstanceId}"
          },
          "metrics_collected": {
            "mem": {
              "measurement": [
                "mem_total",
                "mem_available",
                "mem_used",
                "mem_free",
                "mem_used_percent"
              ]
            }
          }
        }
      }

container_commands:
  01_set_config_and_reinitialize_cw_agent:
    command: powershell.exe cd 'C:\Program Files\Amazon\AmazonCloudWatchAgent'; powershell.exe -ExecutionPolicy Bypass -File ./amazon-cloudwatch-agent-ctl.ps1 -a append-config -m ec2 -c file:cw-memory-config.json -s; powershell.exe -ExecutionPolicy Bypass -File ./amazon-cloudwatch-agent-ctl.ps1 -a start; exit
\
As you may have noticed, I enabled only a few memory-related metrics such as mem_total, mem_available, mem_used, mem_free, and mem_used_percent. However, you can enable more metrics as needed. The complete list of available metrics can be found here.
\
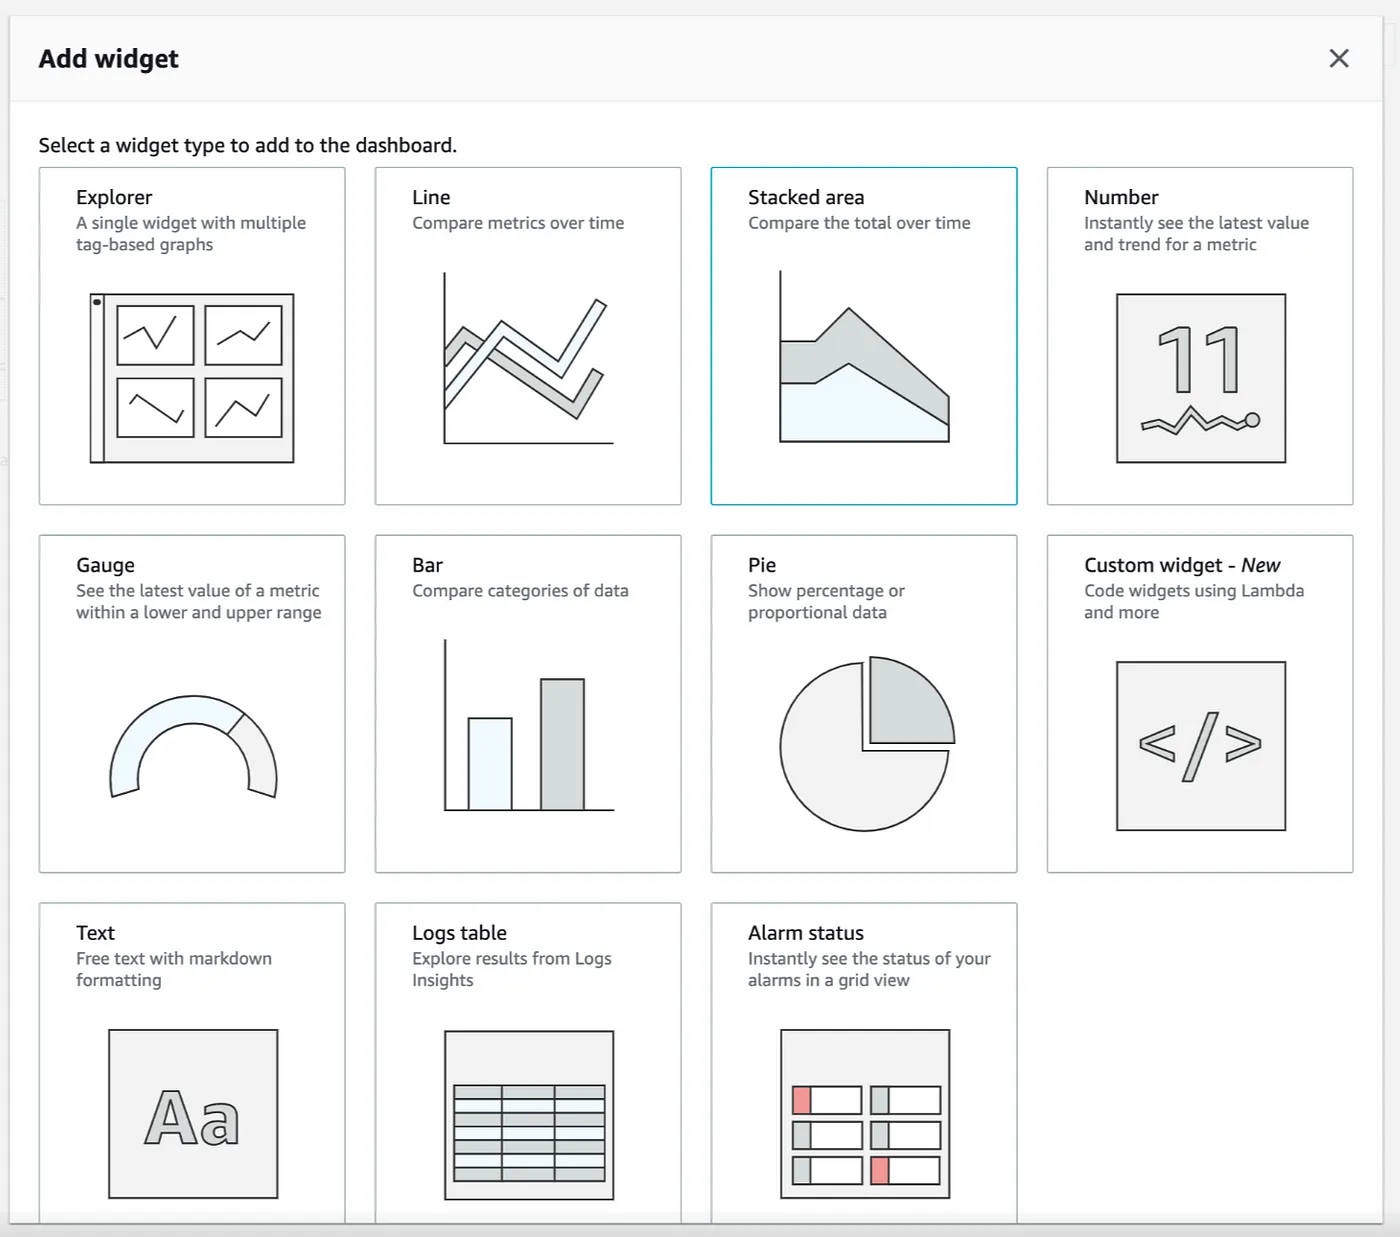
Once you have updated your application, it would be beneficial to create a CloudWatch dashboard to visualize these metrics. To do so, navigate to the AWS CloudWatch console, select Dashboards, and click on Create dashboard. From there, you can create a widget by clicking the Add widget button and selecting Line to create a line chart that displays the desired metrics. Customizing a dashboard with relevant metrics can provide valuable insights into the performance and health of your Elastic Beanstalk environment, making it easier to monitor and optimize your application on AWS.
\
\
In the case of the example above, we’ll see 5 new metrics in the section CWAgent.
\n 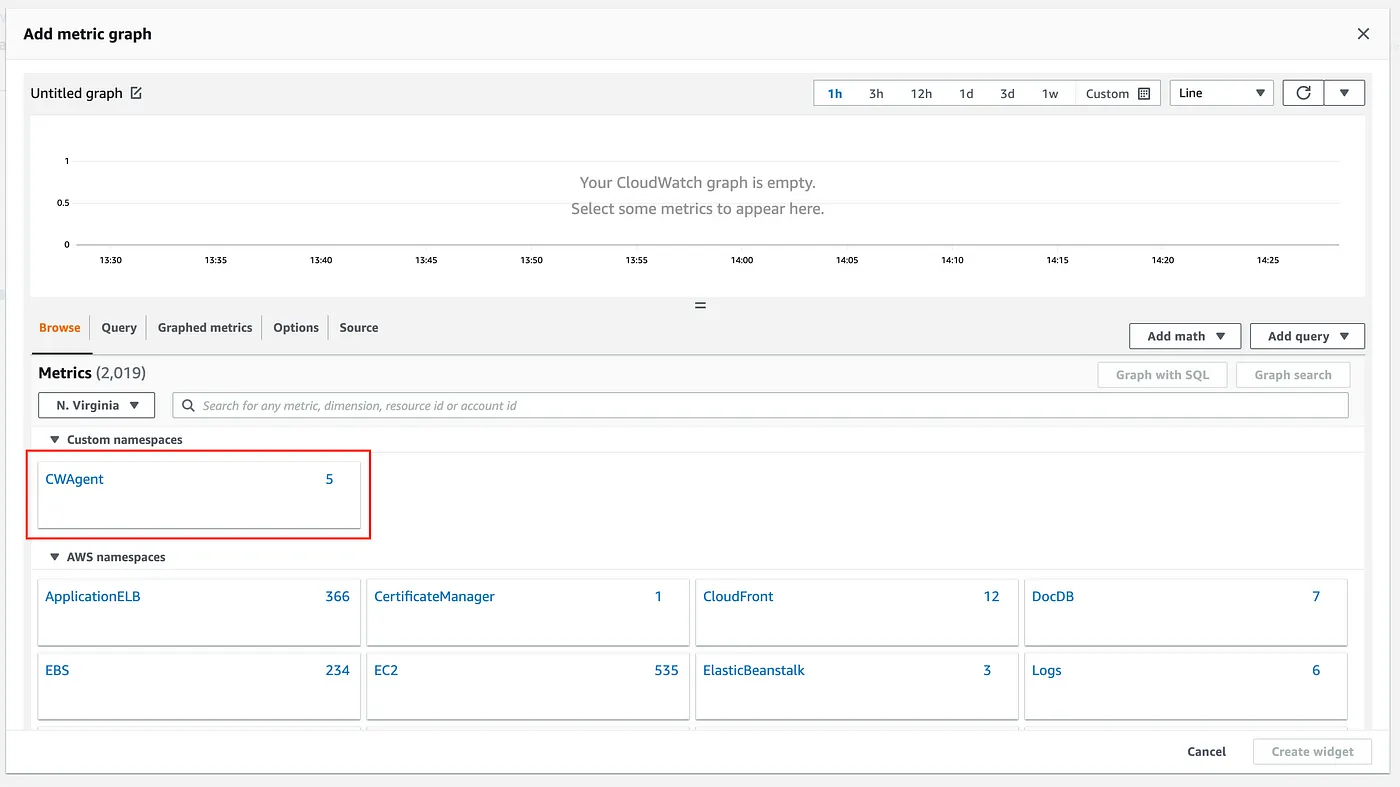
Based on them, we may configure a memory widget and get something like this.
\n 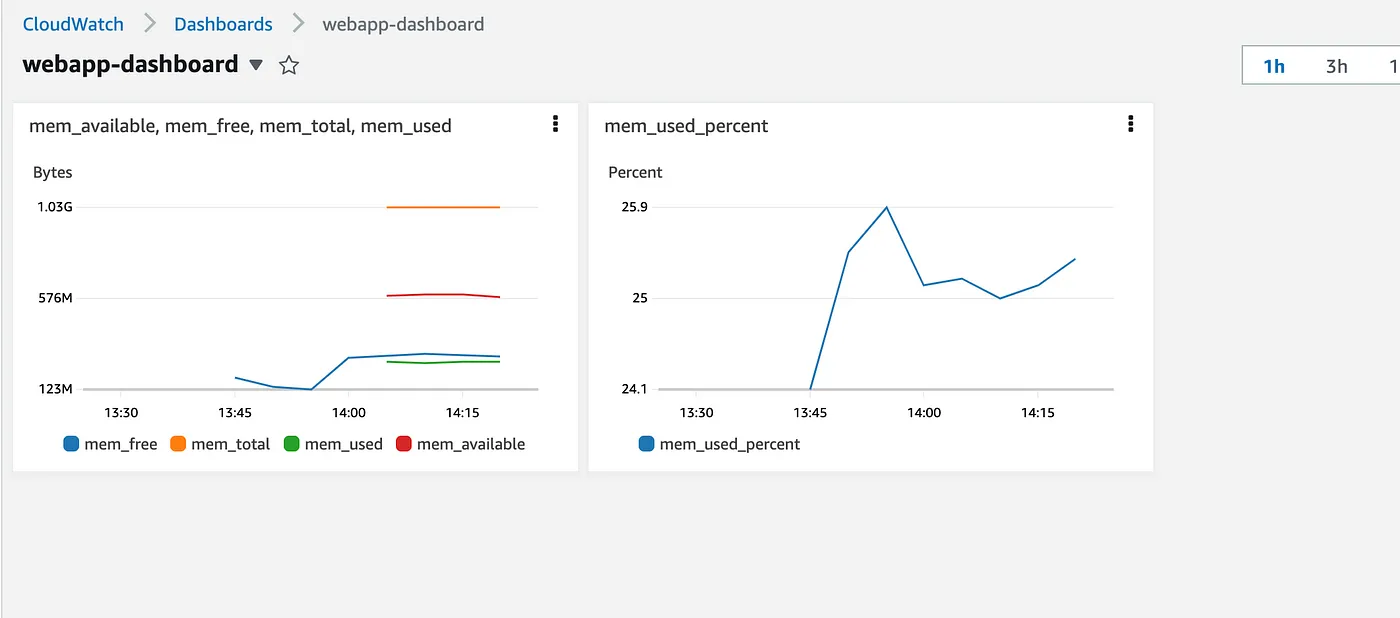
Final Thoughts
The similar approach based on YAML configuration file can be used for a bunch of other AWS metrics, that can be used together with a variety of AWS widgets available in CloudWatch, which allow you to customize your CloudWatch dashboard as you want. It’s interesting, that AWS doesn’t provide memory (and some other) metrics out-of-box for a such developer-friendly service as ElasticBeanStalk. Anyway, using the configuration file described in the article you can easily fix it for all yours ElasticBeanStalk applications.
\ If you have any questions or need assistance, feel free to ask me in the comments.
This content originally appeared on HackerNoon and was authored by Alexander Sharov
Alexander Sharov | Sciencx (2024-09-24T09:45:54+00:00) AWS ElasticBeanStalk Custom Metrics Configuration Based on RAM Metrics Example. Retrieved from https://www.scien.cx/2024/09/24/aws-elasticbeanstalk-custom-metrics-configuration-based-on-ram-metrics-example/
Please log in to upload a file.
There are no updates yet.
Click the Upload button above to add an update.