This content originally appeared on Telerik Blogs and was authored by Dany Paredes
Let’s set up a dashboard with a list of charts for a client, including pagination, options for buttons, numbers or scrolling, and a notification when there are no more items to display. Kendo UI for Angular ListView will make this a snap!
When we build applications and want to show a list of data, tables and grids are good solutions. However, sometimes we want a fancy and custom design to display the data. The most frequently used solution is to use @for or *ngFor for those nostalgic for Angular.
The @for and *ngFor directives are powerful, enabling us to iterate over a list of elements and use our custom designs or components. That is the main reason why most of us use them. However, sometimes they can be a bit limiting.
What happens when we want to highlight the first or last element, implement pagination or add scrolling? In such cases, we must implement all these features ourselves or use a fast, easy and painless alternative.
As always, the best way to learn is to show a real-world scenario.
Scenario
We have been hired to create a demo for a new client. The client wants to display information in a dashboard with a list of charts. These charts will show data about the usage of frameworks by country.
The client wants to visualize the data with charts but also with pagination, with options for buttons, numbers or scrolling, and notifying the user when there are no more items to display. And one more thing… they want the demo ASAP!
My first idea is to use Progress Kendo UI for Angular Charts to visualize the information and combine it with @for to iterate over the mock data. With this initial approach, I think we can start.
Set Up the Project
First, set up the Angular application with the command ng new listview-charts.
ng new listview-charts
cd listview-charts
npm install
(During generation, I chose CSS for the style format and declined SSG/Prerendering for now.)
Next, install the Kendo UI for Angular Charts by using a schematics command to register:
ng add @progress/kendo-angular-charts
To use the full power of Kendo UI for Angular, download a free trial. After that, activate the license by copying the Kendo UI License.txt file into the project, rename it kendo-ui-license.txt and running the following commands:
npm install –save @progress/kendo-licensing
npx kendo-ui-license activate
OK, we are ready to work on the project! Let’s start!
The Mock Data
First, open the project with your favorite editor and copy the example data.ts
file into src/app/data/. It contains the mock example information for the charts:
export const frameworkUsage = [
  {
    country: 'France',
    data: [
      { framework: 'Angular', usage: 125, color: '#DD0031' },
      { framework: 'Vue', usage: 389, color: '#4FC08D' },
    ],
  },
  {
    country: 'Canada',
    data: [
      { framework: 'React', usage: 421, color: '#61DAFB' },
      { framework: 'Ember', usage: 96, color: '#F05E1B' },
    ],
  },....
Perfect, we have the mock data, so it’s time to build the Chart Stats component!
Create Chart Stats Component
The Chart Stats component will work as a wrapper for the Kendo UI Chart. We only need to pass the data as an input to bind it to the kendo-chart component. First, create a new component using the Angular CLI by running the command ng g c components/chart-stats in the terminal.
ng g c components/chart-stats
CREATE src/app/components/chart-stats/chart-stats.component.css (0 bytes)
CREATE src/app/components/chart-stats/chart-stats.component.html (26 bytes)
CREATE src/app/components/chart-stats/chart-stats.component.spec.ts (621 bytes)
CREATE src/app/components/chart-stats/chart-stats.component.ts (253 bytes)
Open chart-stats.component.ts and import the ChartModule to get access to all components provided by Kendo UI Charts. We are going to use a Kendo UI Chart of type column, which requires three fields: data, field and category. So, I will add three input properties:
data: provides an array of datafield: the field to bind in the Kendo UI Chart componentcategory: defines the data field used for the category labels (e.g., usage) in the chart.
The code in chart-stats.component.ts looks like this:
import { Component, input } from '@angular/core';
import { ChartModule } from '@progress/kendo-angular-charts';

@Component({
  selector: 'app-chart-stats',
  standalone: true,
  imports: [ChartModule],
  templateUrl: './chart-stats.component.html',
  styleUrl: './chart-stats.component.css',
})
export class ChartStatsComponent {
  data = input<Array<any>>([]);
  field = input<string>('field');
  category = input<string>('category');
}
Open chart-stats.component.html and add three components from ChartModule: kendo-chart, kendo-chart-series and kendo-chart-series-item.
In kendo-chart-series-item, set the type to column and bind the data, field and category with the signal properties.
Remember to read the signal value using parentheses
(). Learn more about Signals here.
<kendo-chart>
  <kendo-chart-series>
    <kendo-chart-series-item
      type="column"
      [data]="data()"
      [field]="category()"
      [categoryField]="field()"
    >
    </kendo-chart-series-item>
  </kendo-chart-series>
</kendo-chart>
Display the Charts with @for
It’s time to build the dashboard. Open app.component.ts and import and register the ChartStatsComponent in the import section. Because the mock data provides a list of data usage by countries, declare a local variable countries and set it with the frameworkUsage mock data.
The code looks like this:
import { Component } from '@angular/core';
import { RouterOutlet } from '@angular/router';
import { frameworkUsage } from './data/data';
import { ChartStatsComponent } from './components/chart-stats/chart-stats.component';

@Component({
  selector: 'app-root',
  standalone: true,
  imports: [RouterOutlet,ChartStatsComponent],
  templateUrl: './app.component.html',
  styleUrl: './app.component.css',
})
export class AppComponent {
  title = 'listview-charts';
  countries = frameworkUsage;
}
Next, open app.component.html and use the app-chart-stats component to display the charts for each country. You can use the Angular @for directive to loop through the countries array and bind the data to the app-chart-stats component.
Within the *@for, add a new div with the class country and use interpolation to bind country.country to display the name.
The code in app.component.html looks like this:
 @for (country of countries; track country) {
    <div class="country">
      <h2>{{ country.country }}</h2>
      <app-chart-stats
        [data]="country.data"
        field="framework"
        category="usage"
      />
    </div>
  }
Now, our dashboard is set up to display the charts for each country using the ChartStatsComponent.
Open styles.css and add the .country CSS class with the following CSS rules:
.country {
  border: 1px solid black;
  margin: 1rem;
  padding: 1rem;
}
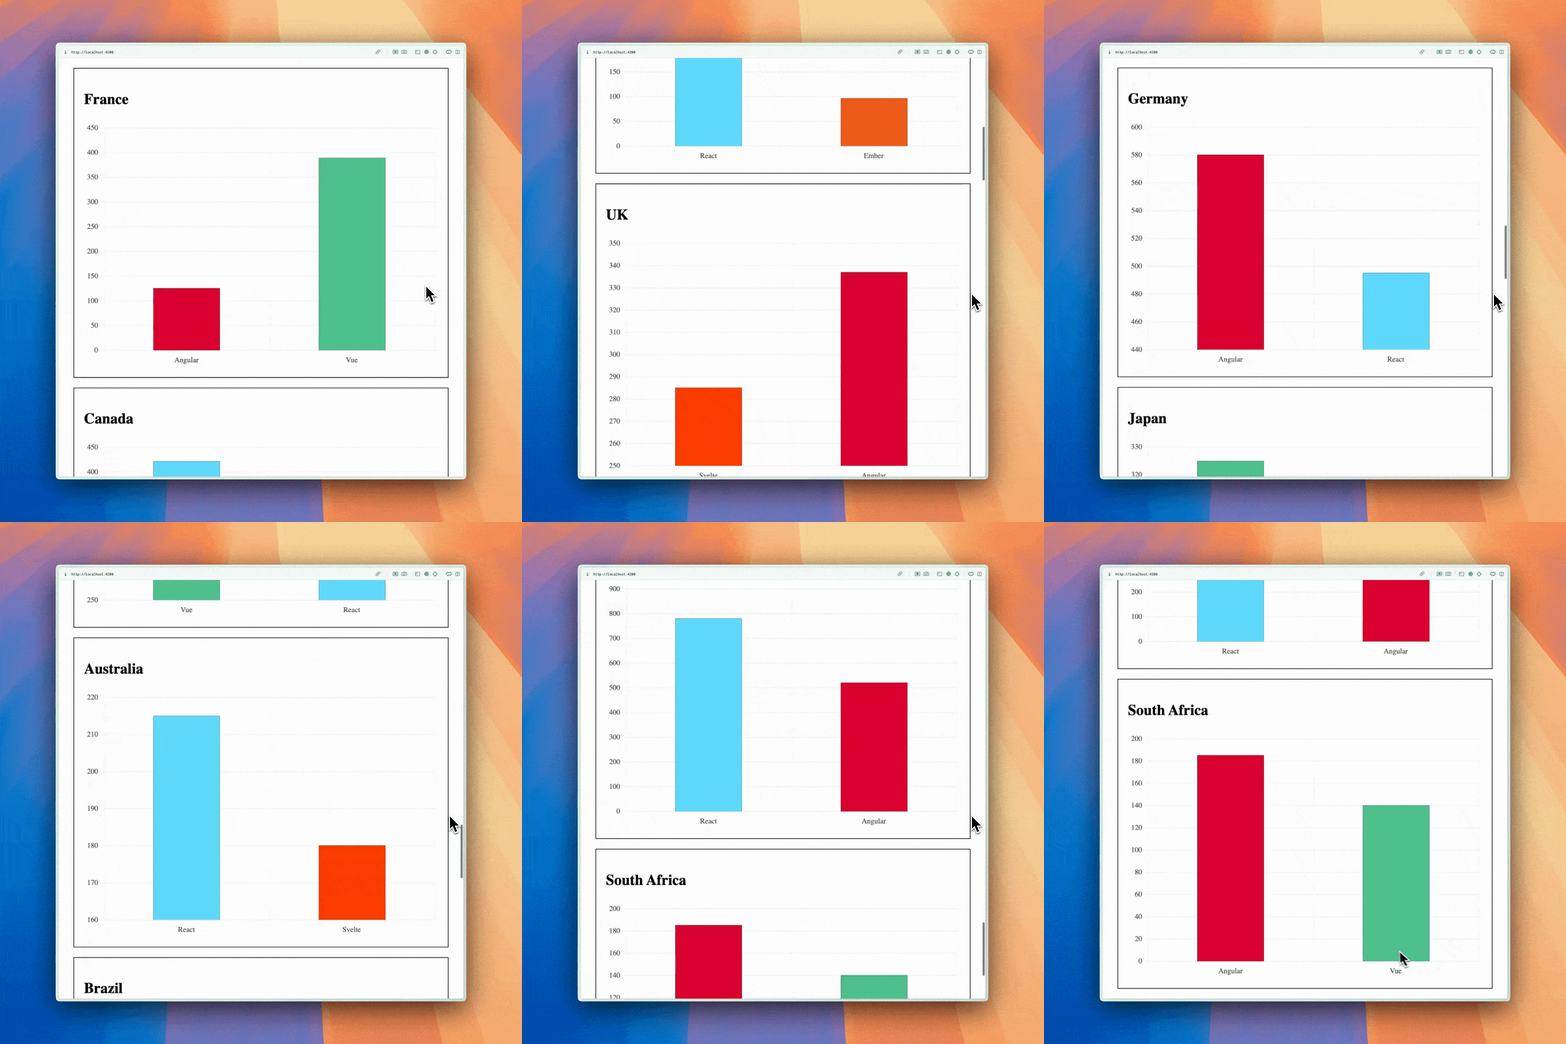
Save the changes and ta-da! We have the dashboard with a list of charts!

Yes, we have a nice format for visualizing data, but a few features are missing, such as pagination, scrolling and others. Let’s start with pagination.
Custom Pagination with @for
We’ll start by creating the pagination.service to handle pagination logic. The pagination service will calculate which items should be displayed based on the current page and page size.
First, run the following command to generate using the Angular CLI:
ng g s services/pagination
CREATE src/app/services/pagination.service.spec.ts (377 bytes)
CREATE src/app/services/pagination.service.ts (139 bytes)
Create an interface to define the structure of the pagination result. This interface includes the items for the current page, the total number of items, the current page number and the total number of pages.
To save time, I will provide the PaginationResult interface, open the src/app/services/pagination.service.ts and paste in the file.
export interface PaginationResult {
  items: T[];
  totalItems: number;
  currentPage: number;
  totalPages: number;
}
In that same file (pagination.service.ts) implement this functionality in the PaginationService class. In this service we are going to provide a method called paginateData that slices the data array based on the current page and page size, then returns the paginated results.
@Injectable({ providedIn: 'root' })
export class PaginationService {
  paginateData(data: any, page: number, pageSize: number): PaginationResult {
    const totalItems = data.length;
    const totalPages = Math.ceil(totalItems / pageSize);
    const startIndex = (page - 1) * pageSize;
    const endIndex = Math.min(startIndex + pageSize, totalItems);

    return {
      items: data.slice(startIndex, endIndex),
      totalItems,
      currentPage: page,
      totalPages,
    };
  }
}
Perfect! Our next step is to use the pagination.service in the app.component.ts. Let’s do it!
Update the App Component
Modify app.component.ts. First inject the PaginationService for handling pagination. Because we need to keep tracking all the data and only provide the items in the current page, we must split the data.
Store the mock data in a new variable called dataServer:
 export class AppComponent implements OnInit {
 dataServer = frameworkUsage;
Note, we are implementing OnInit on this component (to be utilized shortly). Be sure you add this to our import OnInit from @angular/core at the top of the component.
Next, initialize countries with an empty array and configure the pageSize and currentPage.
countries: any = [];
currentPage = 1;
pageSize = 3;
Create a new method bindData() to send the configuration and data to the pagination service, and return the paginationResult object and bind the items to the countries variables.
bindData() {
 const paginatedResult = this.paginationService.paginateData(
   this.dataServer,
   this.currentPage,
   this.pageSize,
 );

 this.countries = paginatedResult.items;
}
Implement the ngOnInit lifecycle hooks to bind the initial data.
ngOnInit(): void {
 this.bindData();
}
To move between pages, we create a new method nextPage(). It increases the currentPage value and decreases prevPage, and then calls again the bindData() method.
nextPage() {
    this.currentPage = this.currentPage + 1;
    this.bindData();
  }
The final code in app.component.ts code looks like:
export class AppComponent implements OnInit {
  dataServer = frameworkUsage;
  countries: any = [];
  currentPage = 1;
  pageSize = 3;
  paginationService = inject(PaginationService);

  ngOnInit(): void {
    this.bindData();
  }

  bindData() {
    const paginatedResult = this.paginationService.paginateData(
      this.dataServer,
      this.currentPage,
      this.pageSize,
    );

    this.countries = paginatedResult.items;
  }

 prevPage() {
    this.currentPage = this.currentPage - 1;
    this.bindData();
  }

  nextPage() {
    this.currentPage = this.currentPage + 1;
    this.bindData();
  }
}
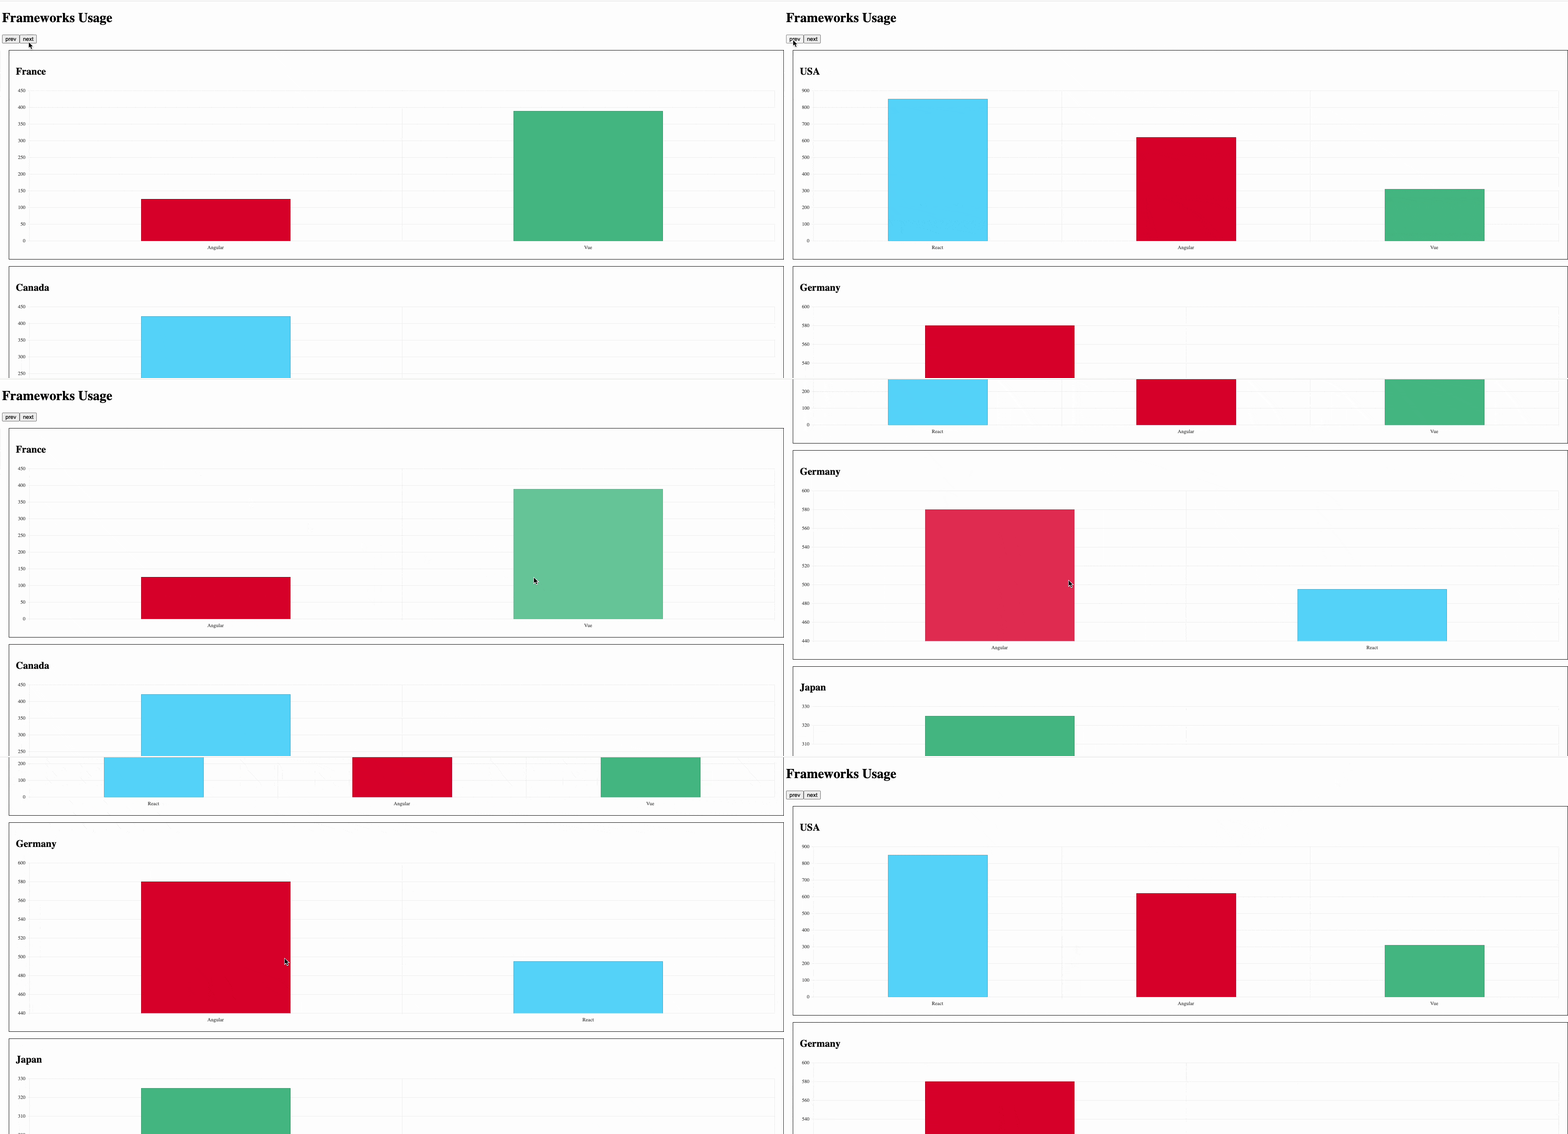
The final step in the pagination is open the app.component.html. Add two buttons, prev and next. In the next button, bind the click event to nextPage function:
<button (click)="prevPage()">next</button>
<button (click)="nextPage()">next</button>
  @for (country of countries; track country) {
    <div class="country">
      <h2>{{ country.country }}</h2>
      <app-chart-stats
        [data]="country.data"
        field="framework"
        category="usage"
      />
    </div>
  }

Uff… we’re only just getting to pagination. Why don’t we take a shortcut to achieve the same functionality and more with just a few lines of code by switching to Kendo UI for Angular ListView? It will make our work easy by simplifying tasks like scrolling, pagination and even highlighting specific elements.
Kendo UI for Angular ListView
Kendo UI for Angular ListView allows us to display a collection of items in a highly customizable list. It is designed to handle complex data sets and provides built-in support for features that we need like:
- Pagination: Easily manage large sets of data by splitting them into pages.
- Scrolling: Implement smooth scrolling and virtualization to efficiently render large lists.
- Item Templates: Customize how each item in the list is displayed using templates.
And more, using Kendo UI for Angular ListView brings built-in functionality for pagination, scrolling and item rendering, reducing the need for custom implementations like pagination, service, type and more.
So let’s take advantage of all these features and move to Kendo UI for Angular ListView.
Moving to Kendo UI for Angular ListView
Go to the project directory again and run the ng add @progress/kendo-angular-listview schematics to add the Kendo UI ListView:
ng add @progress/kendo-angular-listview
✔ Determining Package Manager
  › Using package manager: npm
✔ Searching for compatible package version
  › Found compatible package version: @progress/kendo-angular-listview@16.4.0.
✔ Loading package information from registry
✔ Confirming installation
✔ Installing package
            @progress/kendo-theme-default already installed, skipping styles registration.
UPDATE package.json (1888 bytes)
✔ Packages installed successfully.
Pagination
Instead of using the paginationService, we replace the PaginationResult with the PagerSettings type provided by Kendo UI. This configuration allows you to control pagination settings easily, because the same Angular ListView handles everything—we don’t need the service or extra variable to hold the full data. So assign the frameworkUsage mock data to the country. Let’s also add some config PagerSettings. (We show the previous and next buttons by setting previousNext property and show the total number of items with pageSizeValues set to true.)
country = frameworkUsage;
   public pagerSettings: PagerSettings = {
    previousNext: true,
    pageSizeValues: true,
  };
The code in the app.component.ts looks like:
import { Component, } from '@angular/core';
import { RouterOutlet } from '@angular/router';
import { frameworkUsage } from './data/data';
import { ChartStatsComponent } from './components/chart-stats/chart-stats.component';
import {
  ListViewModule,
  PagerSettings,
} from '@progress/kendo-angular-listview';

@Component({
  selector: 'app-root',
  standalone: true,
  imports: [RouterOutlet, ChartStatsComponent, ListViewModule],
  templateUrl: './app.component.html',
  styleUrl: './app.component.css',
})
export class AppComponent {
   country = frameworkUsage;
   public pagerSettings: PagerSettings = {
    previousNext: true,
    pageSizeValues: true,
  };
}
Replace @for with kendo-listview
Update your app.component.html to use the kendo-listview component. We must bind some properties:
[kendoListViewBinding]: It binds the data to the ListView. It accepts an array of items that you want to display. In this case, it’s bound tocountry, which is our list of data.kendoListViewItemTemplate: This is an Angular template used to define how each item in the ListView should be rendered. It allows you to customize the display of list items—in our case, the h3 with the title and theapp-chart-stats.let-dataItem="dataItem": This provides access to the current item’s data.let-isLast: This variable is part of the Kendo ListView template context and is used to determine if the current item being rendered is the last item in the list. We can use this variable to display special messages or styles for the last item, such as showing a “You have reached the end of the list” message.[pageable]: This property configures the pagination settings of the ListView, in order to show things like previous/next buttons and how many page buttons to display.[pageSize]: Specifies how many items to display per page.
So we have all things for our demo in a single component and just a few lines. The code in your app.component.html should look like:
<kendo-listview
    [height]="550"
    [kendoListViewBinding]="country"
    [pageable]="pagerSettings"
    [pageSize]="pageSize"
  >
    <ng-template
      kendoListViewItemTemplate
      let-dataItem="dataItem"
      let-isLast="isLast"
    >
      <h3>{{ dataItem.country }}</h3>
      @if (isLast) {
        <p>You reach the limit</p>
      }
      <app-chart-stats
        [data]="dataItem.data"
        field="framework"
        category="usage"
      />
    </ng-template>
  </kendo-listview>
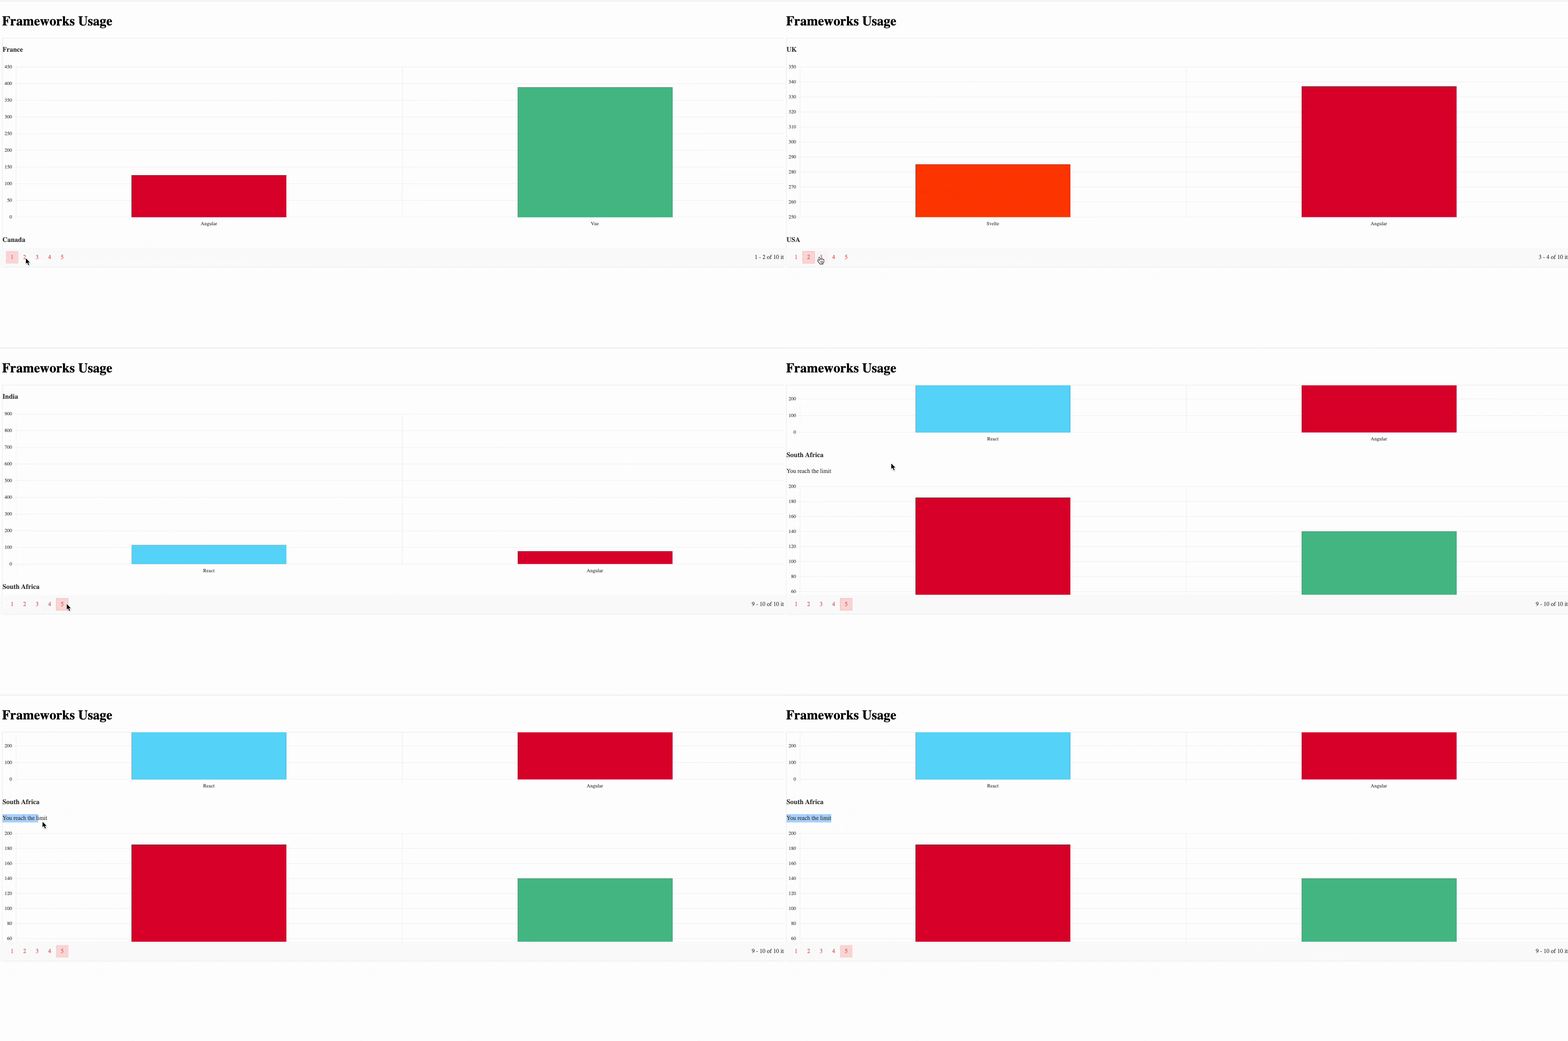
Save changes and tada!!!

We have our dashboard in no time without needing to implement complex logic and covering all features for our demo!
Recap
We learned how to build a dashboard using @for with pagination. Initially, the @for directive allows for custom components easily, but when it comes to adding features like pagination and scrolling, implementing these manually can become complex and require more code.
Moving to the Kendo UI for Angular ListView is a great option because it comes with built-in functionalities like pagination, scrolling, item templates, and more. This saves time on custom implementations, simplifying and speeding up development.
- Source: https://github.com/danywalls/using-kendo-listview
- Kendo UI for Angular ListView documentation
- Angular
@forDirective
And don’t forget: Kendo UI for Angular comes with a free 30-day trial. So go ahead ...
This content originally appeared on Telerik Blogs and was authored by Dany Paredes
Dany Paredes | Sciencx (2024-10-03T10:13:14+00:00) Build Dashboard with Charts Using Kendo UI for Angular ListView. Retrieved from https://www.scien.cx/2024/10/03/build-dashboard-with-charts-using-kendo-ui-for-angular-listview/
Please log in to upload a file.
There are no updates yet.
Click the Upload button above to add an update.
