This content originally appeared on HackerNoon and was authored by Vincent
\
Introduction
(this felt like hacking but it isn't)
Going through past Instagram posts to get a short term ego boost that will dissipate in a matter of seconds
I was going through my old Instagram posts trying to find how many people liked my posts. I even went through the ones in the archive (I had like 20 archived posts gathering dust). I needed an ego boost (who doesn’t like a good ego boost? If you don't, you're probably lying).
\ And then, after a boring 5 minute period where I had a stream of random thoughts going through my head, I was like … why not graph the data of my instagram post trends? (all for the ego boost of course)
There were a few benefits to this:
Using intense mental gymnastics, and systematically ignoring all the possible disadvantages, I could spend much more time looking at my old likes and comments without guilt of wasting time, or seeming egocentric. Instead of like going through Instagram, I would be “analysing data visualisations”, which sounds much more productive.
\
I would list out all the possible disadvantages but as I said in the previous point I ignored it. Those possible disadvantages were ignored just like friction is ignored in physics problems 💀 .
\
\ \
Improving problem solving and creativity (this one is a no 🧠 brainer)
\
I can actually produce a *neat* graph -- I am highly messy drawing mathematical graphs (shaky hand and terrible coordination are my worst enemies.

\
Getting started (not procrastinating and scrolling reels)

\ You log onto instagram.com. The default login page asks for your username and password. You blindly give it to them to access the content that will eventually give you brainrot. The first post on the page is the source of brainrot: some random person singing slang.
\ Your friend, at the same time also blindly gives his password and username to instagram.com. But the first post on the page was a fresh out of the oven cooking video, emanating the intense heat vibes to their eyes.
Unbelievable
How come he gets to see delicious food while I have to hear people chanting 'sigma' over and over again? (this actually happened)
It's the same website but the content is different. The website is a dynamic website which changes content every time you reload. (imagine scrolling through mindlessly until you click the reload button. The relatable meme you were about to send to your best friend is now gone forever.)
Step 1: Data doesn’t just appear on the page, it comes from somewhere
How does the browser know what to display? Surely all the brainrot Instagram reels cannot be all stored in one file?
Well the website needs a little help in displaying the data so it has to fetch the data from another source. Think of a dog fetching a bone from another place, to complete the full picture of a happy dog wagging its tail with a bone in its mouth. Good little doggy.
\

\
Step 2: Well where does the data come from then?
Snooping around the page won't get you anywhere. You have to go deeper.
\ Here's a magic trick: go right click and inspect elements.
\ Now you can see al the code that makes it work. A giant chunk of messy HTML blows up in your face. Not cool. How can you find all the data now?
\ Well the interesting part is the network tab. Shows all the network requests being sent and the data being transferred. Think of it as a busy metro station with the trains as data requests, transferring goods (data) from station A (instagram servers) to station B (your browser).
\
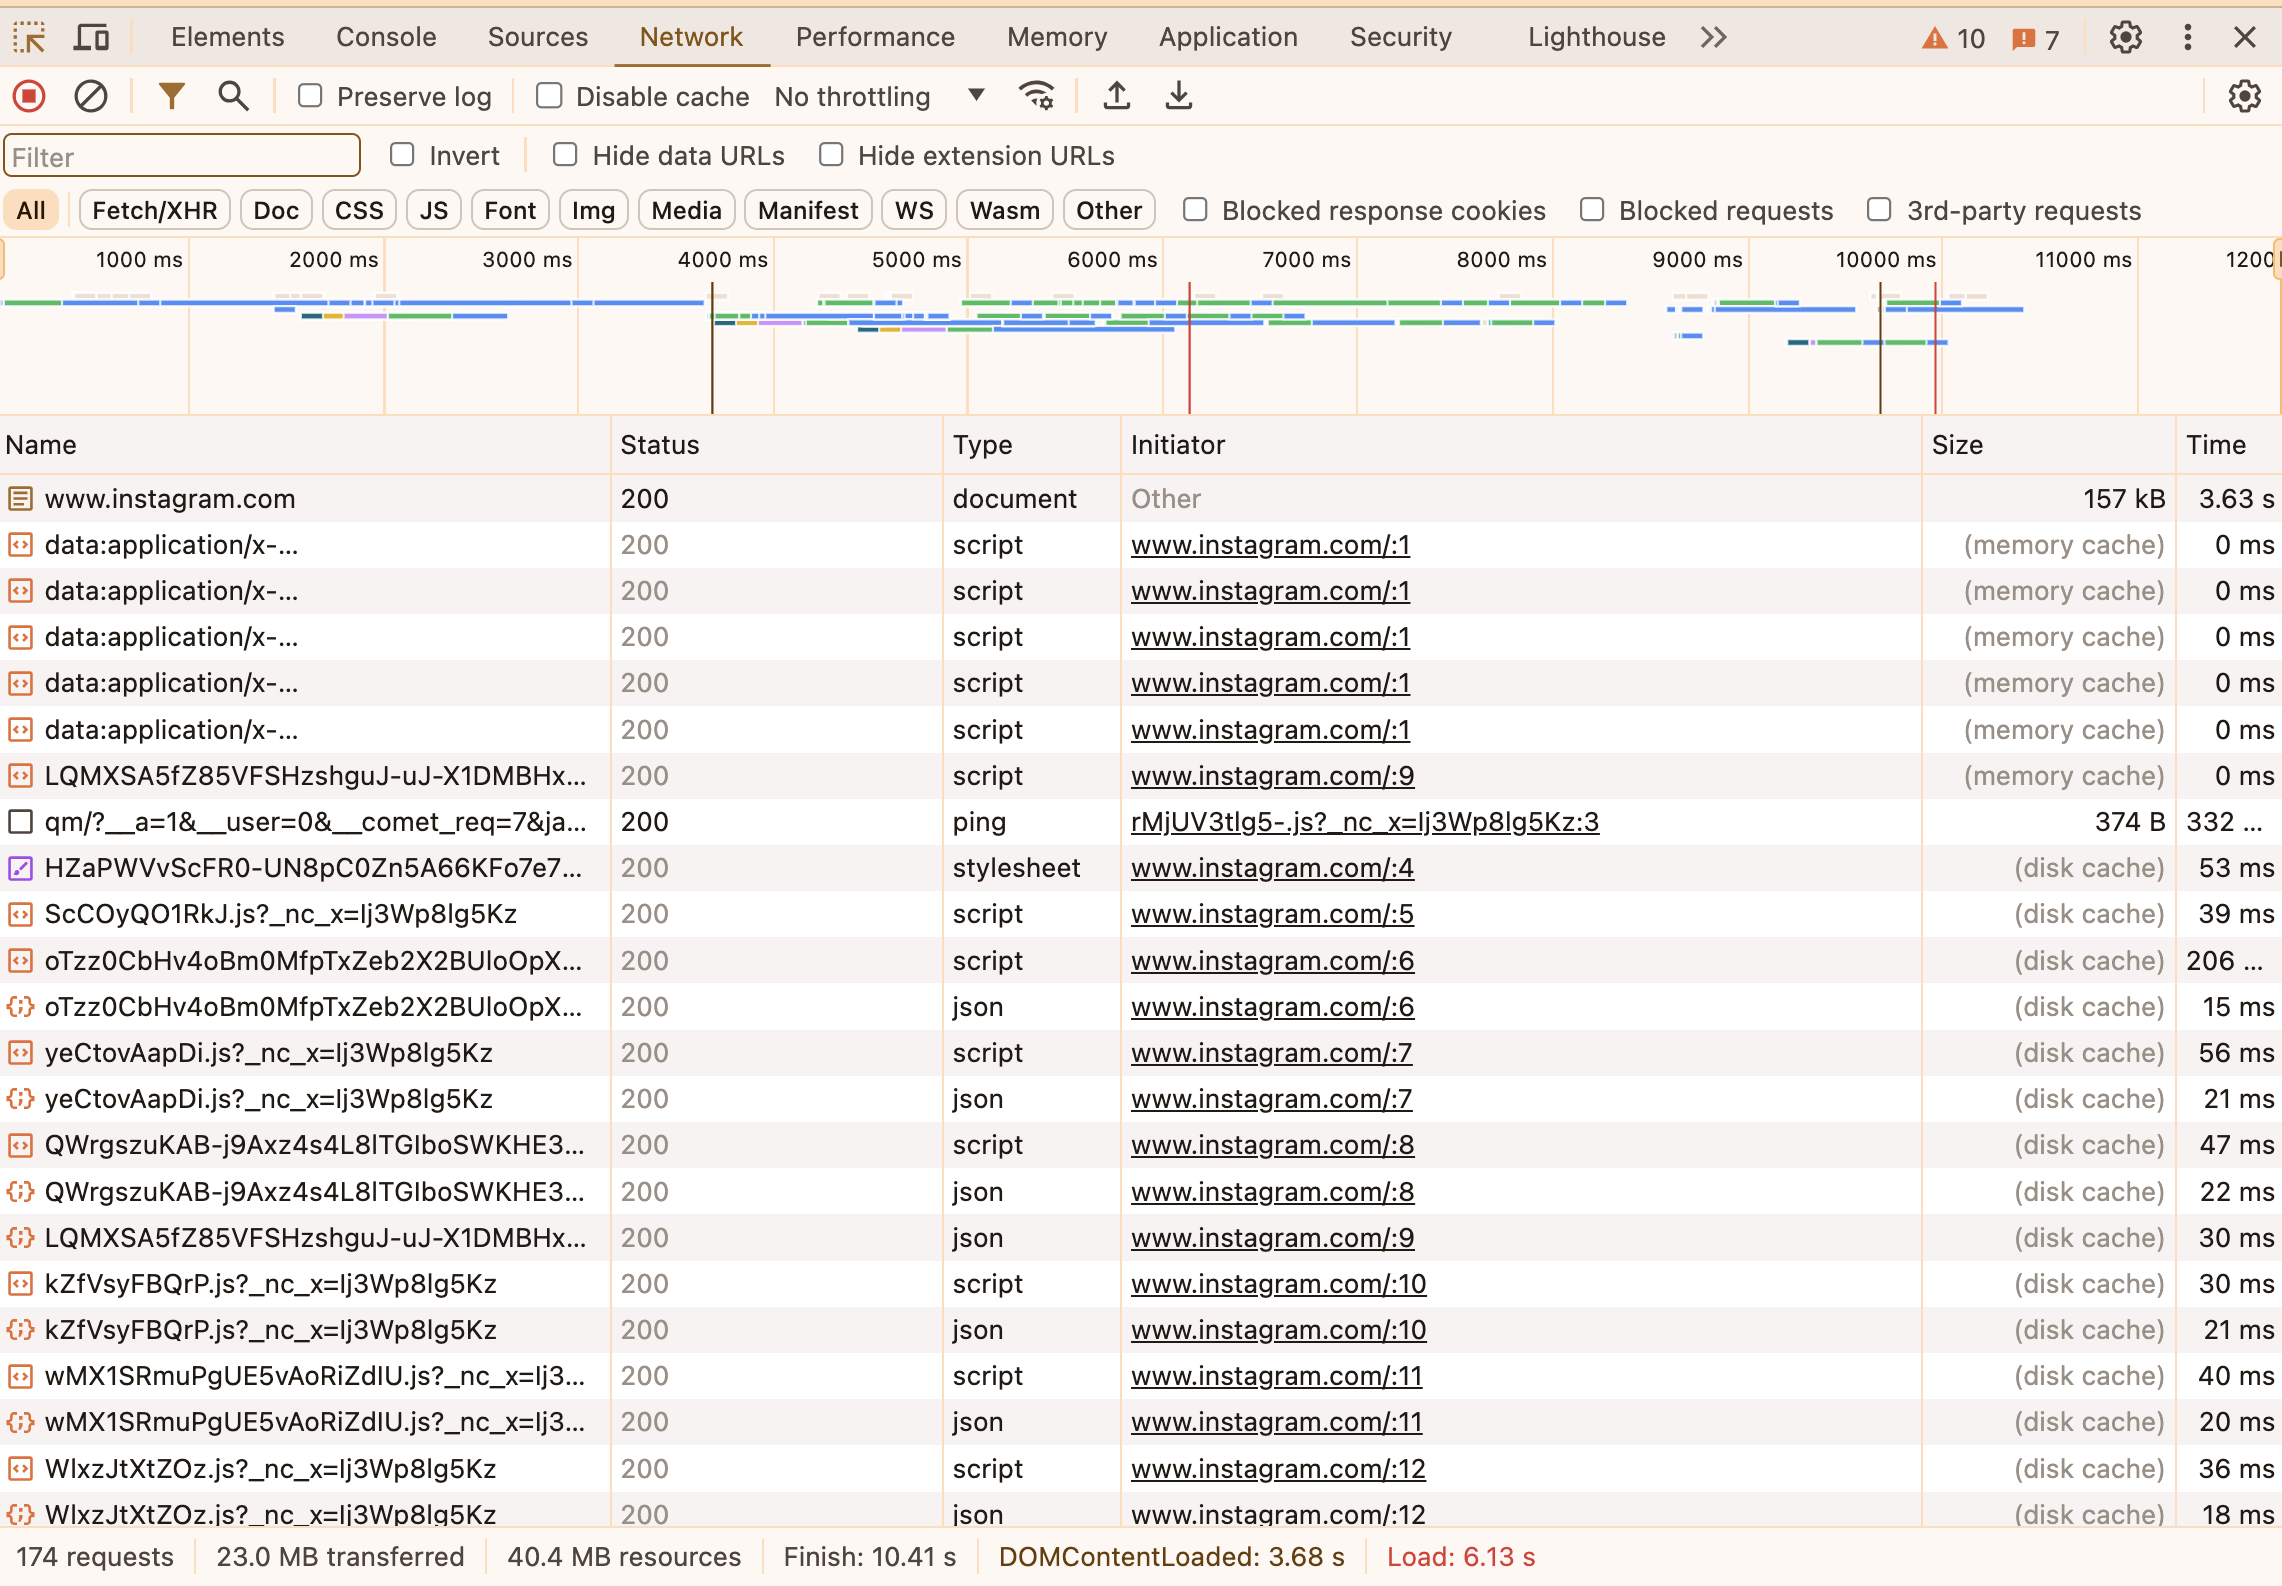
\ And then after looking through all the hard to read scripts in there,
\
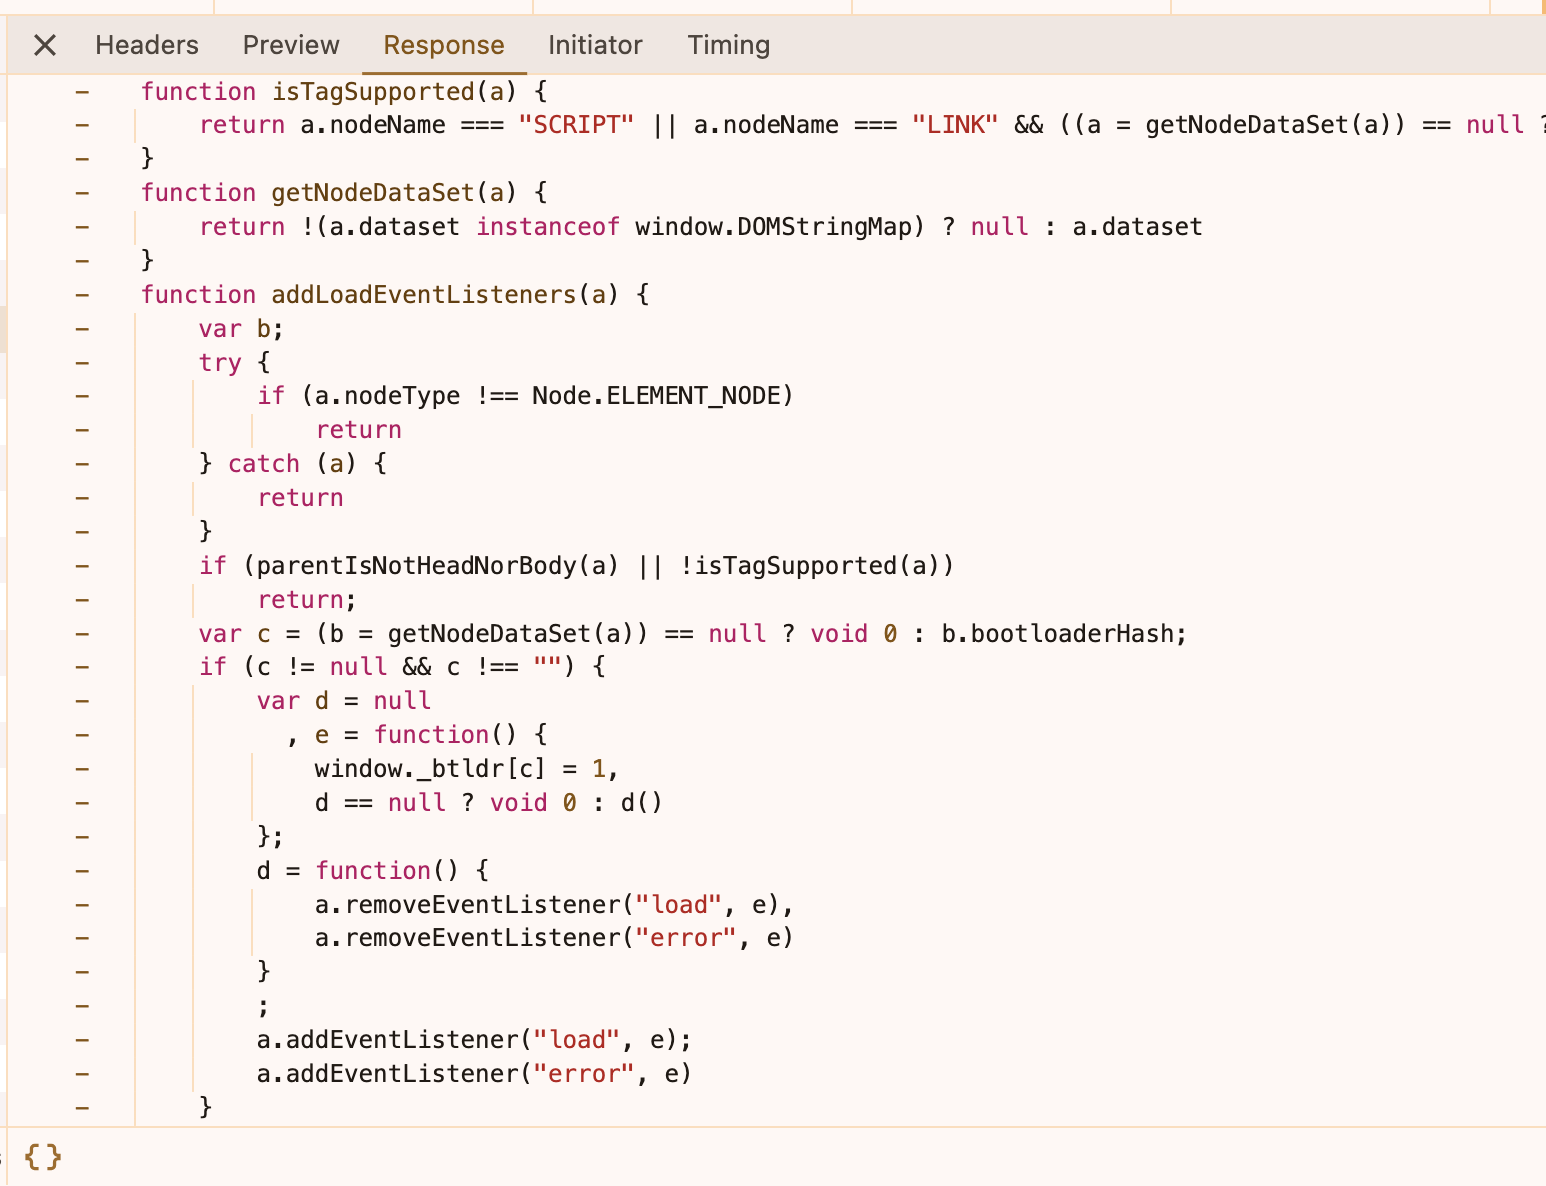
\ all the boring HTML,
\
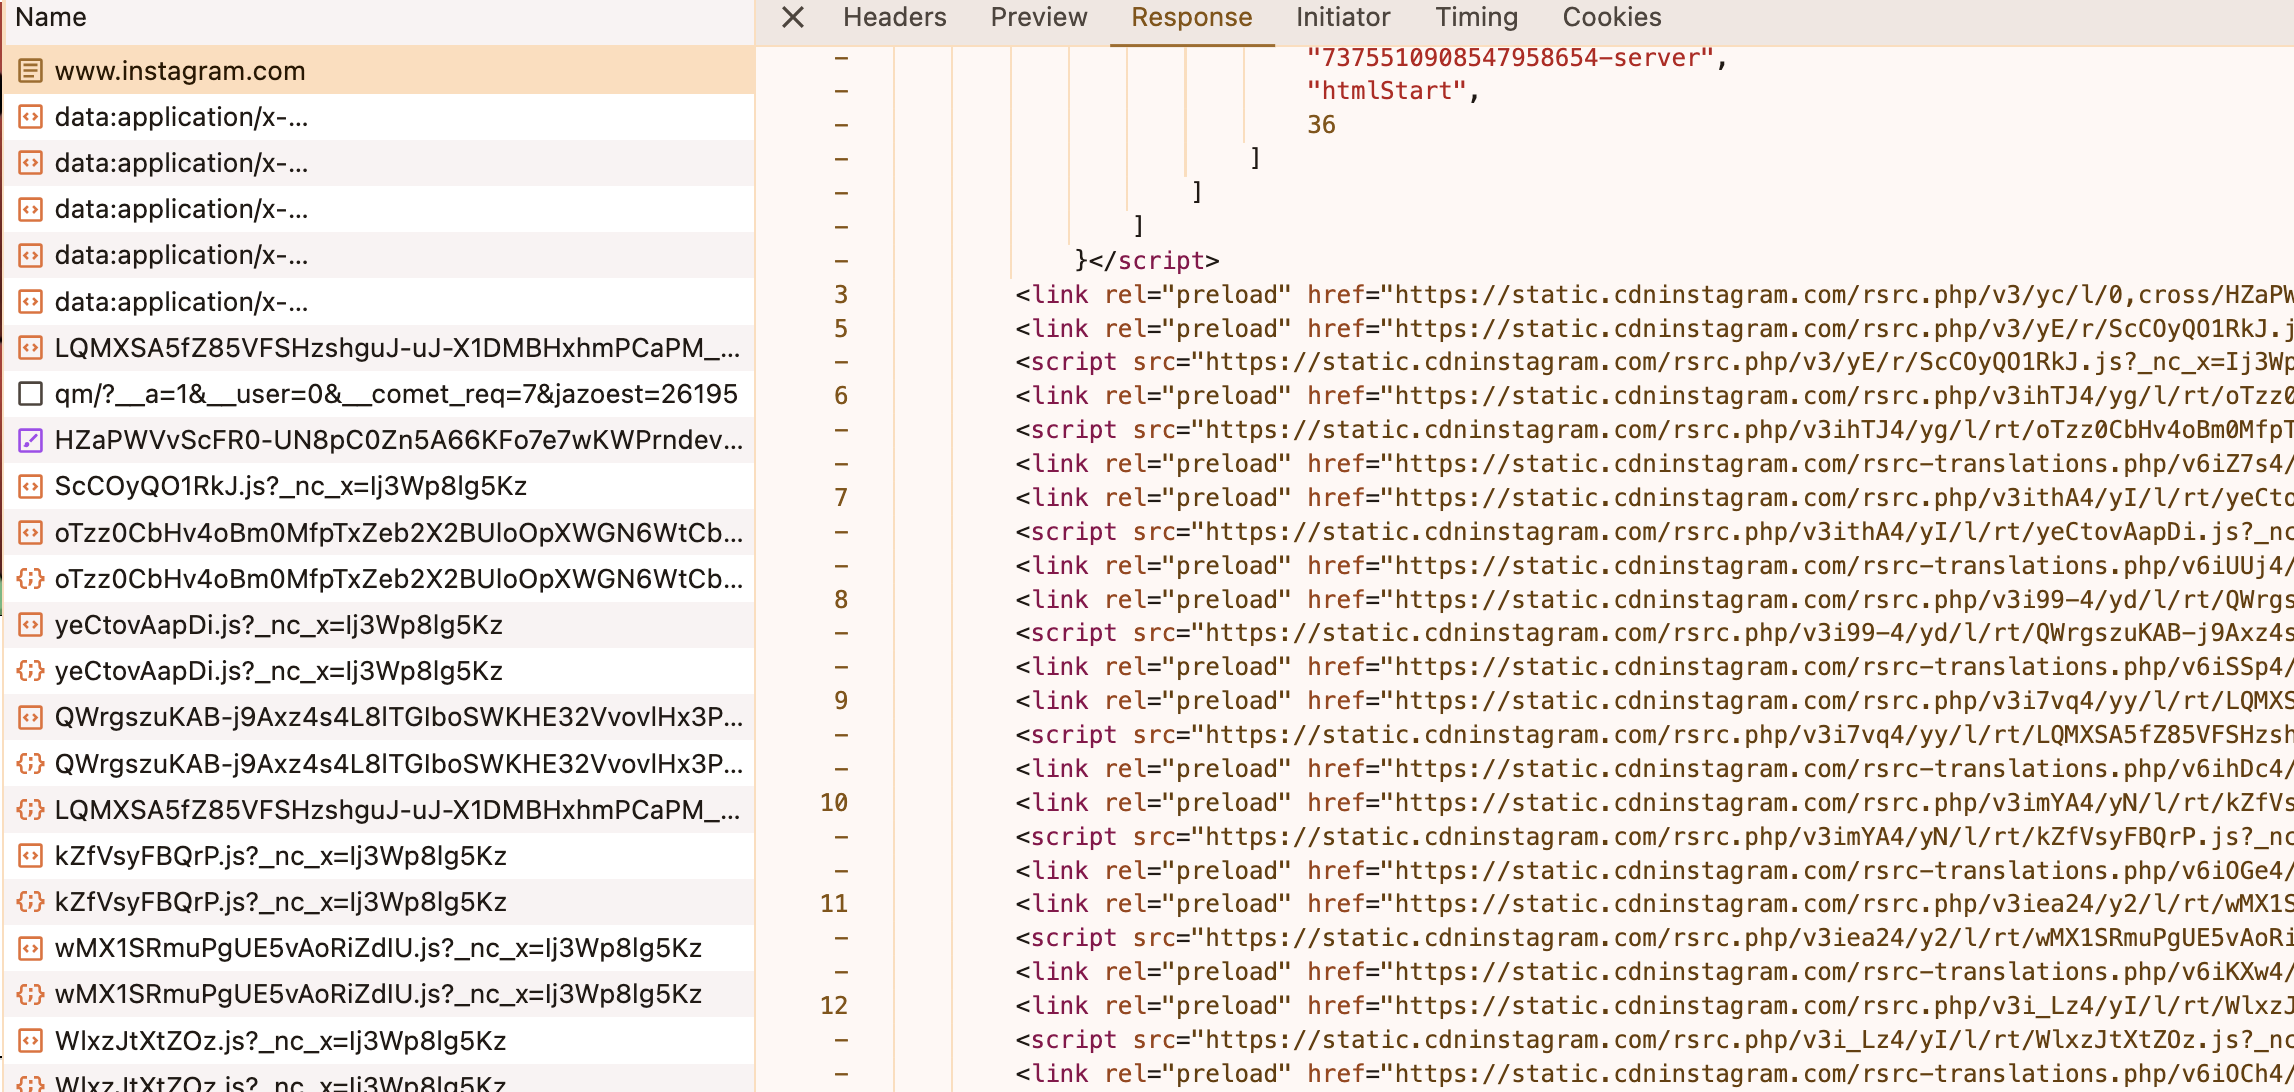
\ I found this interesting section
\

Fetch/XHR: The source of the data river (probably)
All external data is sent to and from servers here. By looking through the requests you can find lots of interesting stuff the website gets from servers, or what it sends. Most of the time though it looks like gibberish.
Step 3: Scrolling through Instagram (productively)
In order to find where the server gets the data, I had to scroll through a lot of network requests :). Forget scrolling through memes and reels, lets scroll through network requests!!!!
\ Eventually after *hours* (or what felt like hours) of searching I found this:
\
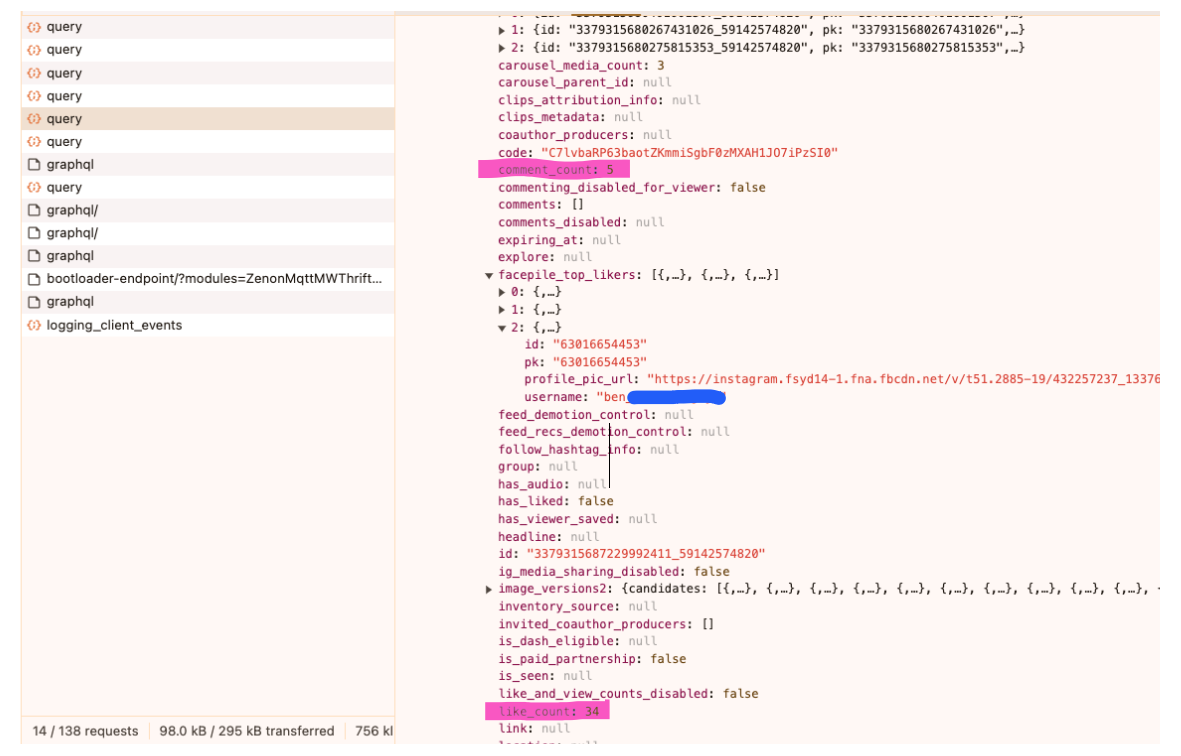
\ The chosen one. A list full of all the data on posts, including the link count, and the comment count, in convenient JSON format.
Step 3: I got the data, now what
Now we need to figure out how we can get the data by performing a similar request programatically.
Introducing: Postman - not the one on the motorcycle (as if we see them anymore) but the application online that makes metaphorical data deliveries to your virtual mailbox.
Step 4: Roleplay as instagram.com
Time to pretend to be like a drama student with the roleplay.
\
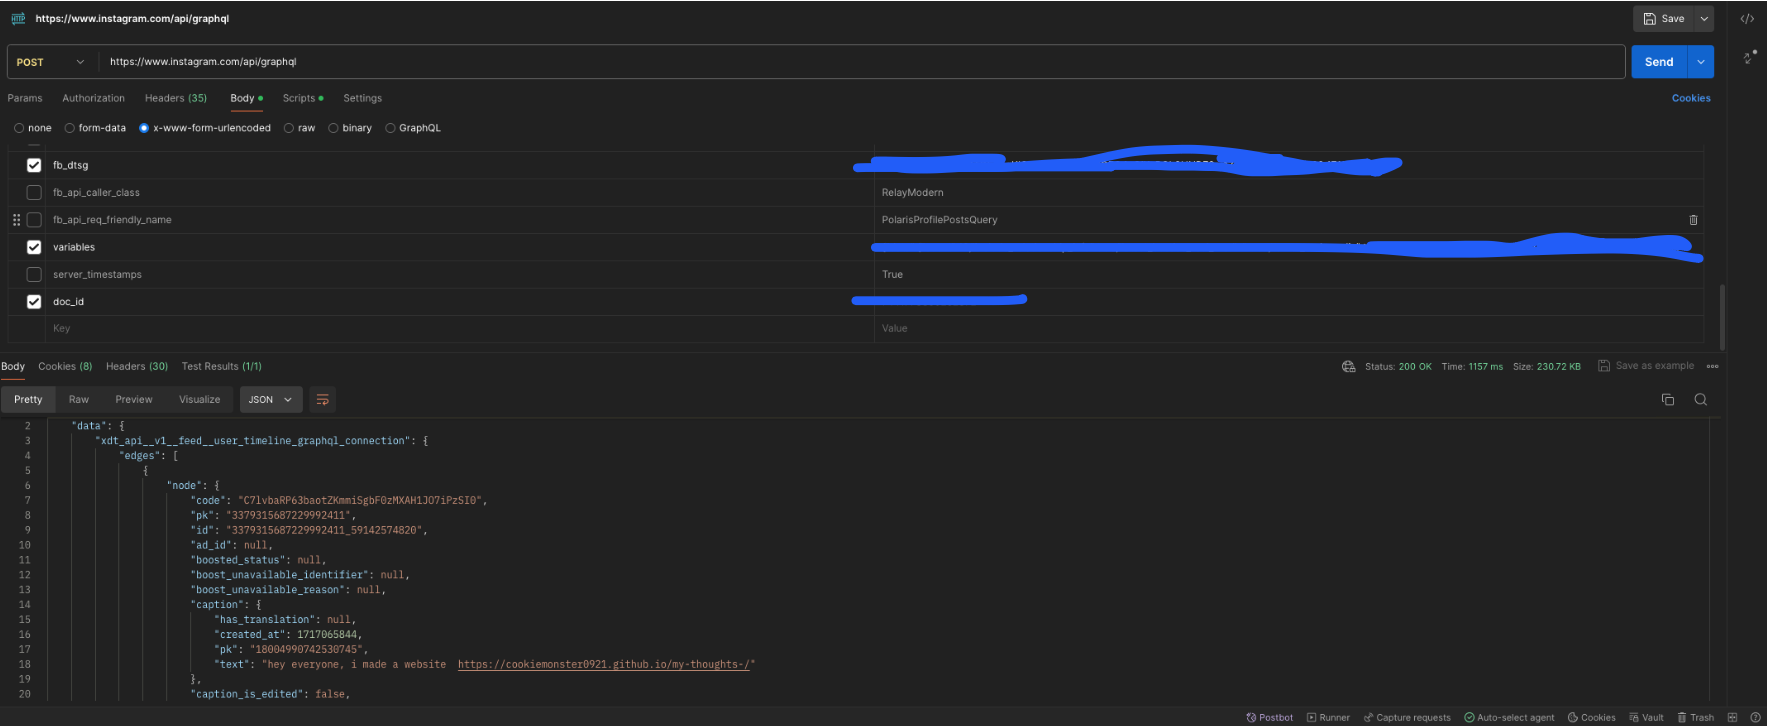
\ This sends a request to instagram just like how the browser sends a request for data. I had to match exactly how the request is made in the network tab; including copying what seems like the most trivial of metadata (that was a very painstaking process), into the Postman parameters in order to get the same data, my way.
\
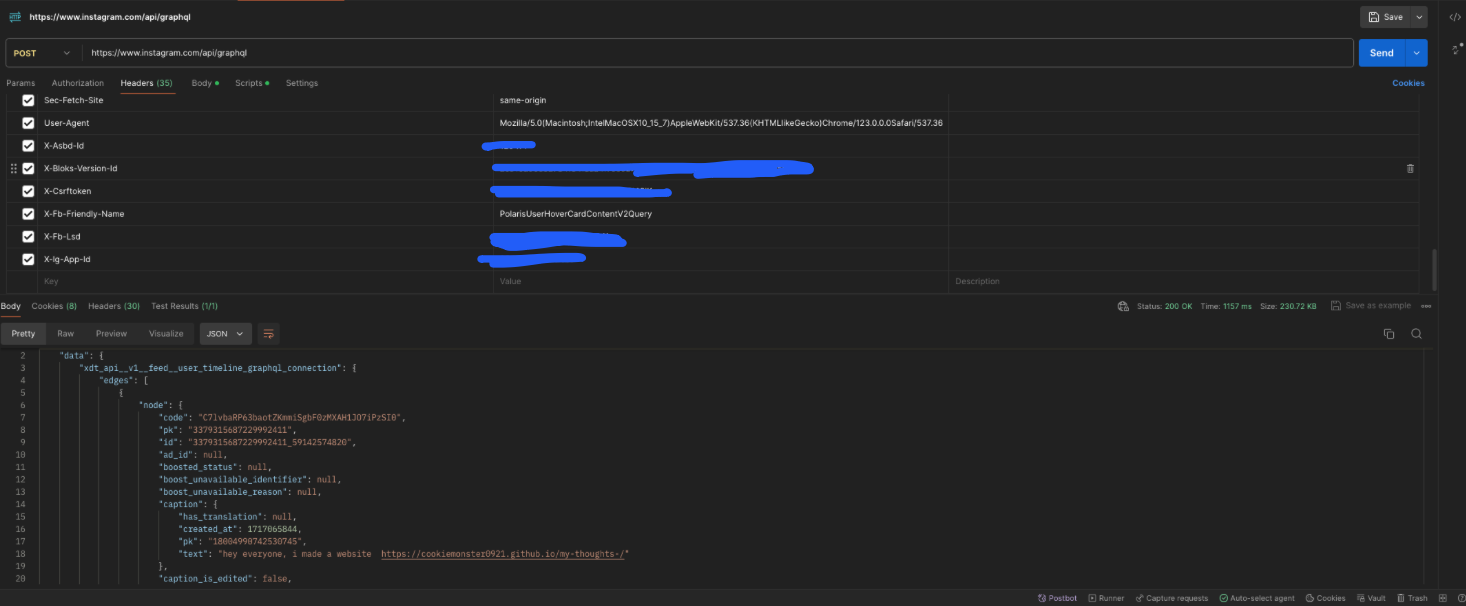
\ At this point, I could go on and on about how I got here, my thought process and everything that I have tried. But I know you didn't order a yappachino so moving on .💬
Step 5: Python
Copy the python version of the postman request and boom -- you've got yourself a script that fetches instagram data :)
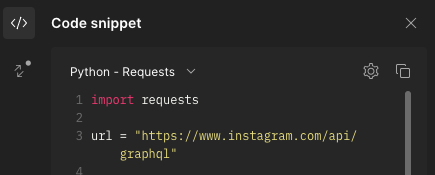
\ Unfortunately the request body payload might contain sensitive data that may or may not be impacting my own account so I cannot share it here.
\
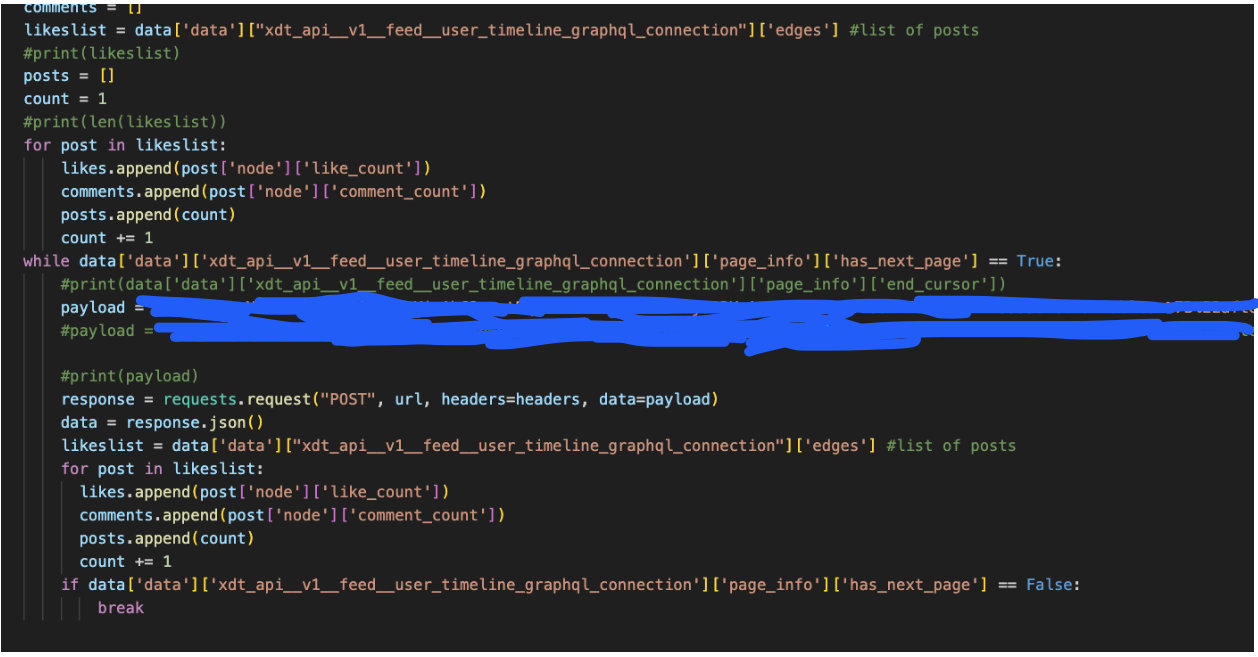
\ All this script does is continually make a network request to grab Instagram data, passing different parameters (on which page/posts to search) and request body data to collect all the data about the posts. This is necessary because Instagram only grabs the data for around 12 posts at a time, this means that if someone has, say 24 posts I would have to send a request 2 times. It parses the JSON data and adds the number of likes into a list, and the number of comments into another list.
Step 6: Non messy graphing
It's graphing time.
\
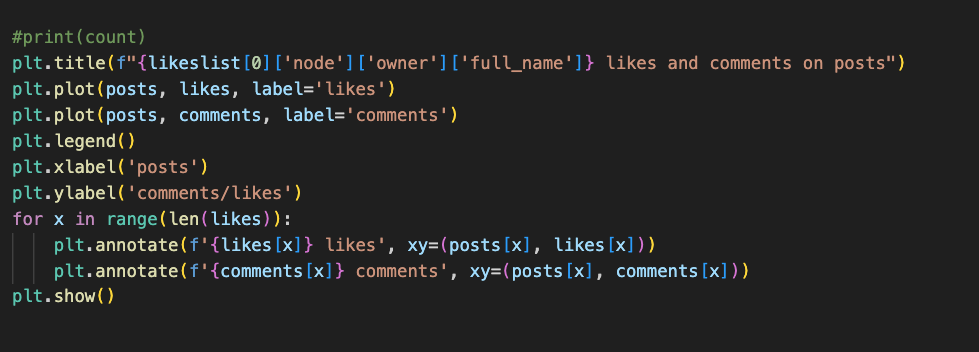
\ Set x values as post numbers, y values as likes and comments respectively and boom →
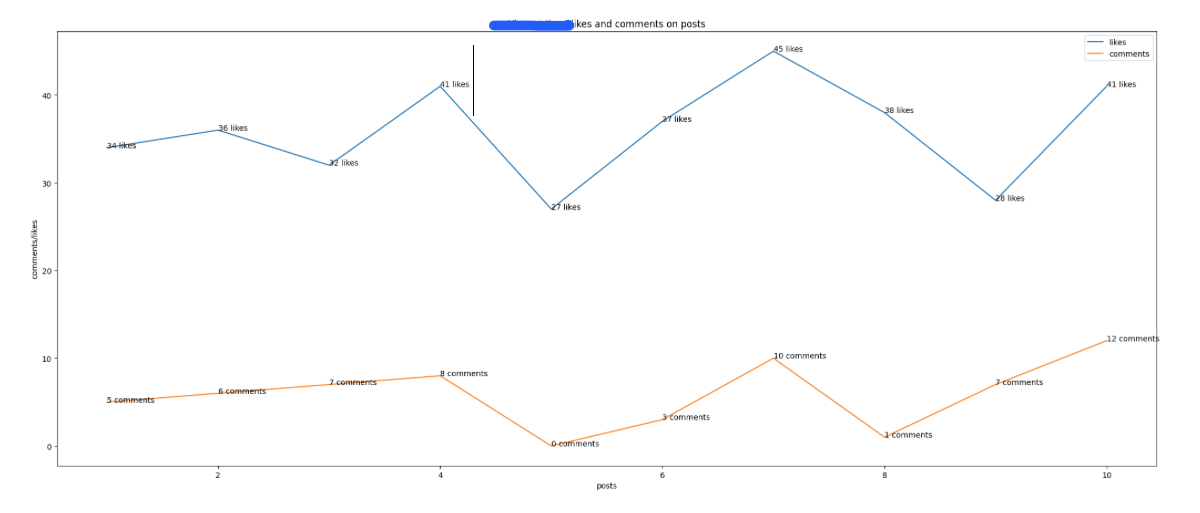
Step 7: Graph done WOOHOO
And there we have it. A shiny graph full of data, collected fresh right out of Instagram. It’s a perfect flex to use on friends and a nice way to look at Instagram productively. (We’re “analysing data visualisations” here people, not “scrolling reels”.)
\ Hopefully this was not a bunch of waffle, and if I was yapping too much let me know so I can submit an application to become the waffle house's new host :)
This content originally appeared on HackerNoon and was authored by Vincent
Vincent | Sciencx (2024-11-12T06:12:28+00:00) Graphing Likes and Comments on Instagram Posts to See the Trends Visually. Retrieved from https://www.scien.cx/2024/11/12/graphing-likes-and-comments-on-instagram-posts-to-see-the-trends-visually/
Please log in to upload a file.
There are no updates yet.
Click the Upload button above to add an update.
