This content originally appeared on Bits and Pieces - Medium and was authored by Nethmi Wijesinghe
Now, you can use Chrome DevTools to visually inspect your CSS Grids and debug them.
CSS Grid is a layout module that allows you to design and develop complex, responsive web designs more efficiently while maintaining consistency among browsers.
For a developer, CSS Grid is a tool that helps in dealing with things like code reusability, infinite screen sizes, page loading speed, and so on. At the same time, for a designer, it supports delivering the client’s message effectively.
In other words, both developers and designers primarily benefit from CSS Grids. Therefore, in this article, I’ll guide you through inspecting and debugging page layout issues using Chrome DevTools, helping both parties.
Debugging CSS Grids with Chrome DevTools
When you design your web pages, have you ever felt that you need to see how grid lines overlap, the line numbers, or the grid area names? Understanding what’s going on behind the scenes of CSS Grid would be super useful, right?
So the good news is, Chrome DevTools released the support for CSS grid debugging in October 2020.?
Now let’s see how we can inspect and debug layout issues using Chrome DevTools.
Getting started with Grid debugging is super easy! When display: grid or display: inline-grid applied to an HTML element, grid badge can be seen next to the element in the Elements panel. If you move the mouse pointer over the grid badge, you can see that an overlay appears over the element, like a grid to display the position of its grid lines and tracks.
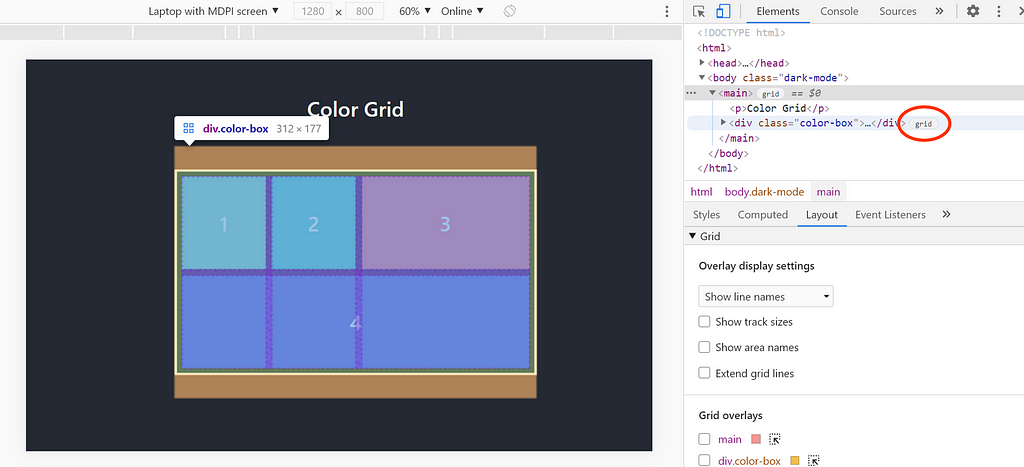
As you can see, there is a new section called Grid in the CSS pane’s Layout view, containing a number of options that help you for a better grid inspection.
Tip: If the Layout view hasn’t appeared at the bottom of the Chrome DevTools, open Show Experiments from the Command Menu (Ctrl + Shift + P) and check the option labeled Enable new CSS Grid debugging features. You might need to reload DevTools to apply the changes.
Now let’s take a look at different options available in the Grid section. This section contains two sub-sections.
1. Grid Overlays
This section contains a list of all the grids present on the page with a checkbox, and by toggling grid overlays on and off, you can select the grids you want to debug. In the Grid overlays, you can:
Enable Overlay Views of Multiple Grids.
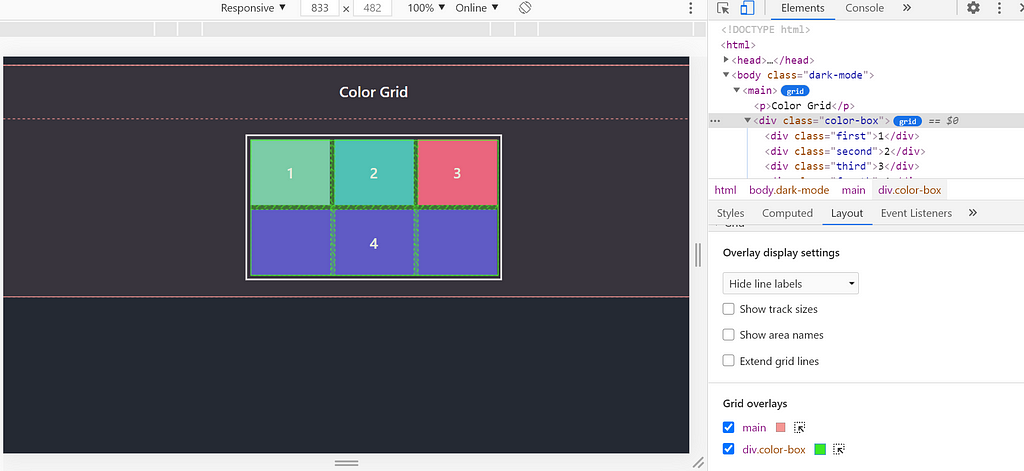
By selecting the checkbox, you can toggle the grid overlays on and off. In the example given, both the grid overlays enabled, each represented with a different color.
Customize the Grid Overlay Color.
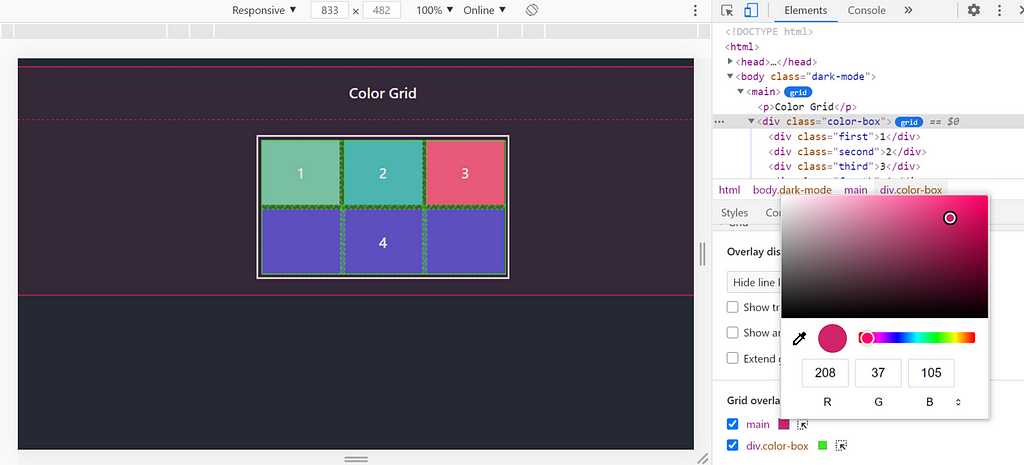
This option helps you to identify your grids apart easily by allowing you to select a color of your choice from the color picker.
Highlight the Grid
You can immediately highlight the HTML element that a specific grid entry relates to by clicking the highlight icon.
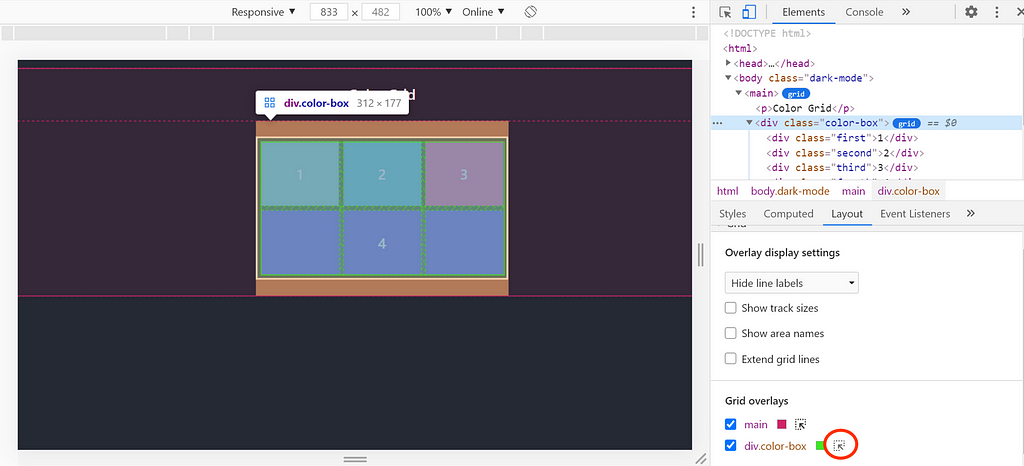
Oh! Did I mention that you can customize your grid overlay? Well, you can do that now ?. Overlay display settings, the second subsection is all about different properties that help you better visualize and debug the Grid.
Tip: Share your reusable components between projects using Bit (Github).
Bit makes it simple to share, document, and reuse independent components between projects. Use it to maximize code reuse, keep a consistent design, speed-up delivery, and build apps that scale.
Bit supports Node, TypeScript, React, Vue, Angular, and more.
2. Overlay Display Settings
This section includes several options like show line numbers, show line names, etc. Let's see what those options mean and what are the uses of them.
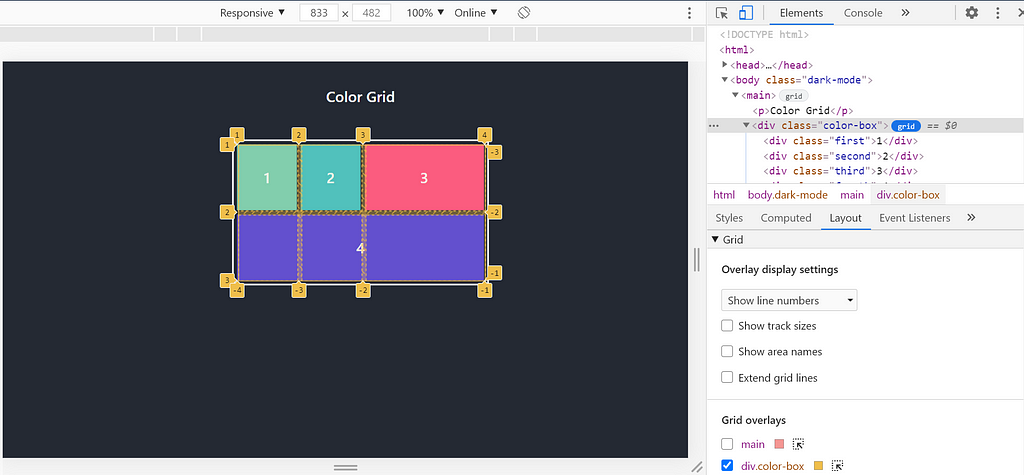
Show line numbers
By default, line numbers are displayed on the grid overlay.
Show Line Names
Selecting this option from the list will display the line names instead of the numbers.
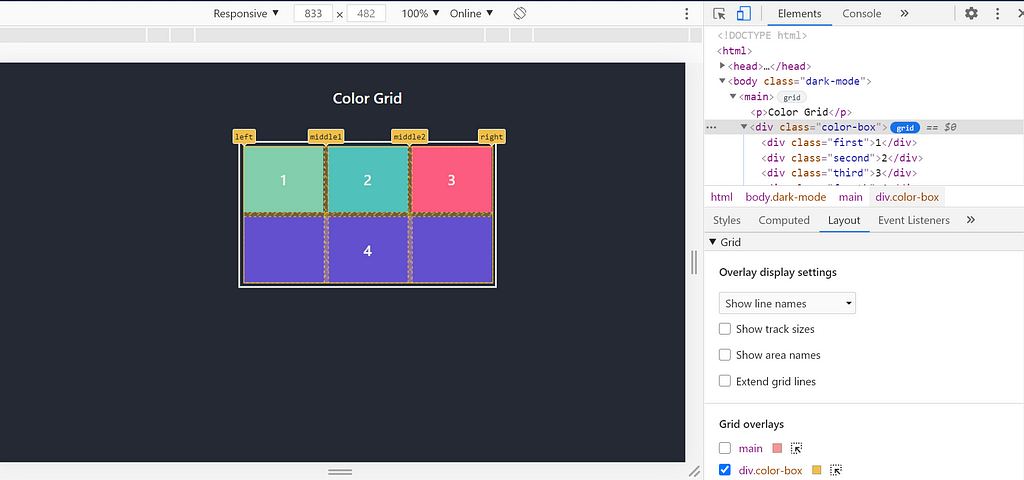
Displaying line names makes it easy to visualize the start and the end positions of an element. As you can see in the above example, there are four lines: left, middle1, middle2 and right. Moreover, the element which is numbered with 4 spans from left to right.
Hide Line Labels
Likewise, you have an option to hide the line labels and line numbers for each grid overlay.
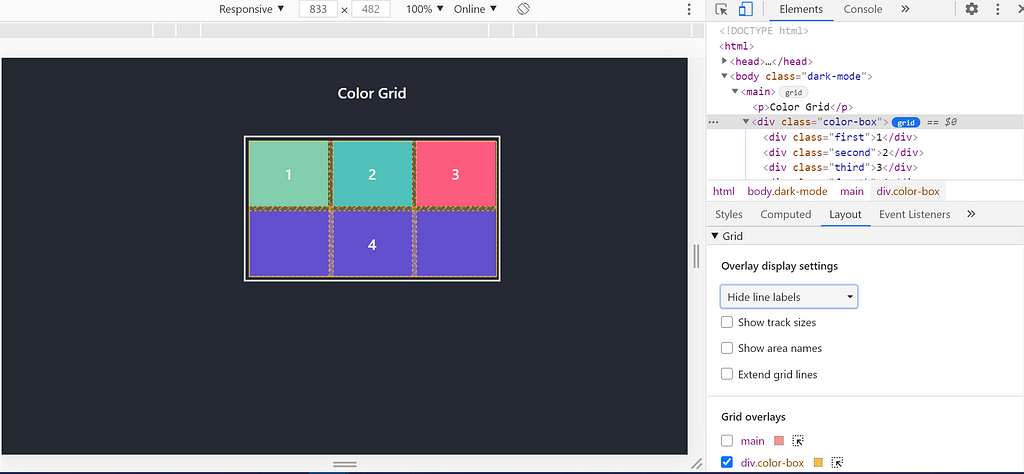
Show Track Sizes
By enabling this option, you can view the track size of the Grid. DevTools display the [authored size].[computed size] for each line label, where authored size is the size defined on the stylesheet and computed size is the actual size on the screen.
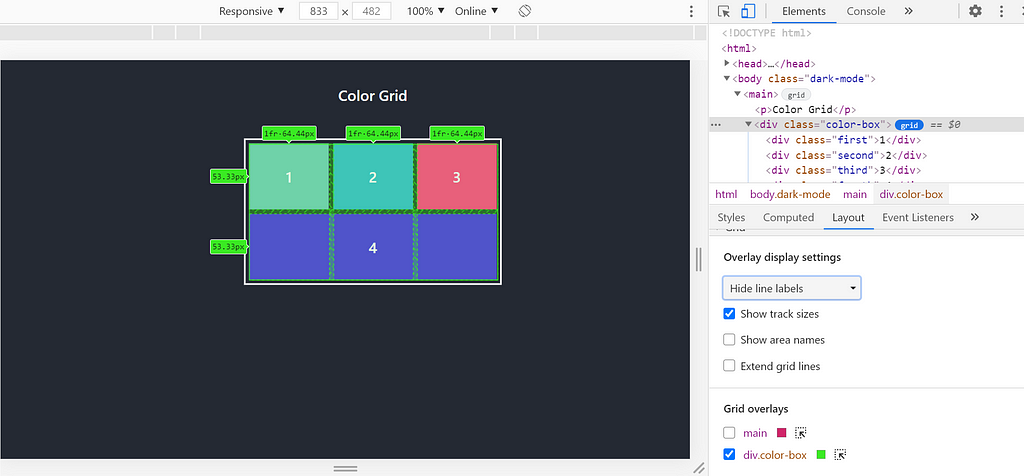
As you can see above, for each column line label, both authored and computed sizes are displayed. However, for the row line labels, only the computed size can be seen. That is because color-box column sizes are defined in the CSS, and for rows, no row size is defined in the stylesheet.
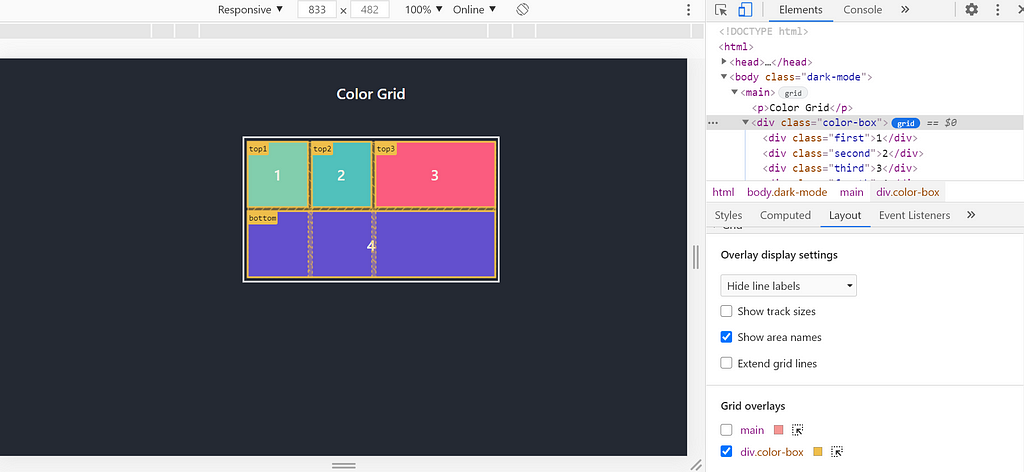
Show Area Names
You can toggle to show or hide area name, in the case of grids with named grid areas. As you can see in the following example, there are four areas in the Grid — top1, top2, top3, and bottom.
Extend Grid Lines
By default, grid lines can only be seen inside the element with display: Grid or display: inline-grid set on it. By toggling this option, you can extend the grid lines to the edge of the viewport along the axis.
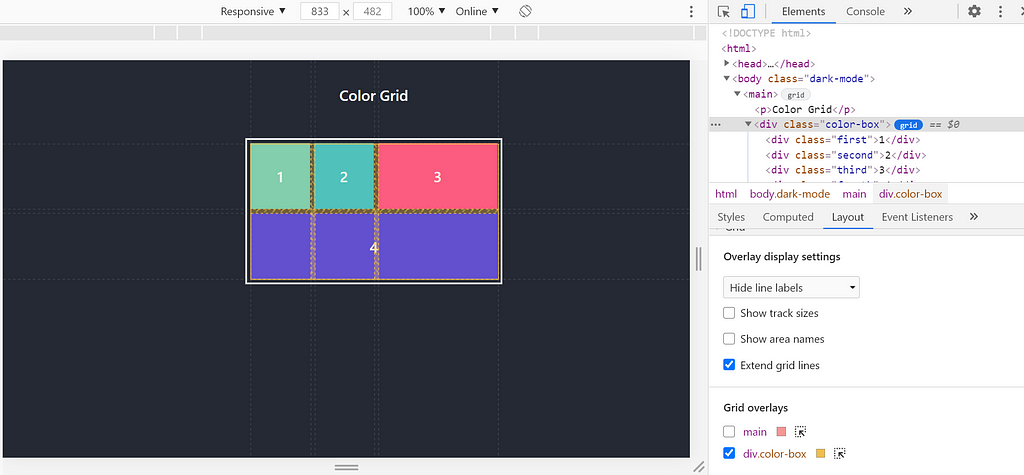
As you can see, all the options mentioned above helps us in big-time defining which block is rendered where.
Final Words
Although numerous tools help Front-End Developers build grid-based websites, introducing CSS Grid Layout introduction marks a significant milestone.
Besides, CSS Grid has come a long way since its introduction in 2011. Now it supports all the major browsers.
With the growing popularity, the State of CSS Survey results in 2020 show that CSS Grid usage has increased by 18.6% from 2019.
With the recent support with DevTools, it made the debugging process more comfortable than ever before. As I have mentioned earlier, DevTools makes it straightforward to work with the CSS grid. You can visualize all your grid data, inspect, and debug arisen with a click of a button. Besides, knowing the Layout pane options will help you to debug your CSS grid like a PRO! ?
Thank you for reading! Feel free to hit me up with your thoughts in the comment section below ?.
Learn More
- Improve Page Rendering Speed Using Only CSS
- Does your Interviewee Understand CSS Layouts?
- Introducing Layout for Material-UI
Debugging CSS Grid like a PRO was originally published in Bits and Pieces on Medium, where people are continuing the conversation by highlighting and responding to this story.
This content originally appeared on Bits and Pieces - Medium and was authored by Nethmi Wijesinghe
Nethmi Wijesinghe | Sciencx (2021-02-17T21:42:19+00:00) Debugging CSS Grid like a PRO. Retrieved from https://www.scien.cx/2021/02/17/debugging-css-grid-like-a-pro/
Please log in to upload a file.
There are no updates yet.
Click the Upload button above to add an update.
