This content originally appeared on DEV Community and was authored by Craig Taub
The fiit website is used for creating subscriptions as well as helping users log into the app on TV platforms such as Sky and Amazon. As such it is an important asset to the business, but ultimately does not change very often.
For some time there has been a memory leak on the website. How can we be sure? I think the memory graphs below are pretty self explanatory. This is the memory usage over a normal week (shows min/max and average in green).
You can see every 1-2 days it would increase up to 100% before it eventually crashes and then starts the process all over again.
The stack is out of date, with some node modules being 3 years behind, and NodeJS being version 10 (which was released in October 2018). At time of writing LTS is 14.17.
So we know there is a leak, it could be our code or it could be an out of date version. Where to start?
Plan A - Local profiling
We thought we would start by analysing our code. We would run the application in production mode, and take memory snapshots with Chrome dev-tools at various times. Comparing the difference between the snapshots should hopefully highlight the cause.
However there were a couple of other problems to solve first...
Problem #1 - How to thrash the server locally?
We used Apache Benchmark to do this. It is pretty great, you can set the total number of requests and number in parallel. E.g
ab -c 50 -n 5000 -k http://localhost:8080/
Problem #2 - Which pages to thrash?
Now we have a tool which we can use to replicate high user volume, where should we target?
The website uses GA, so I grabbed the 2 most popular pages, one of which is the homepage, and planned to use both of those.
Problem #3 - How to capture the memory of a server run via docker containers?
This has 3 steps
- On the docker image expose the NodeJS debugger port (this is 9229). e.g
9229:7001 - On the docker image start the application with the debugger on. E.g.
--inspect=0.0.0.0and garbage collection exposed--expose-gc(the reason is so we can trigger GC before we collect a snapshot, therefore isolating the parts of memory which are not being collected properly) - Open Chrome inspector (
chrome://inspect/#devices) and add a target tolocalhost:7001(our remote debugging port) - Find the application you want to profile running in the list, click it and you will get an open Chrome dev-tools. From here we can use the "memory" tab to take heap snapshots.
Now we are running our server application on a docker container, and can connect to the box's memory.
Local profiling
We decided to start with 1000 requests, 30 at a time.
We would take a memory heap snapshot every 2 minutes for about 8 minutes, forcing a GC (global.gc()) each time.
Then at the end compare the different snapshot, looking for items with a large footprint i.e. 1% or greater.
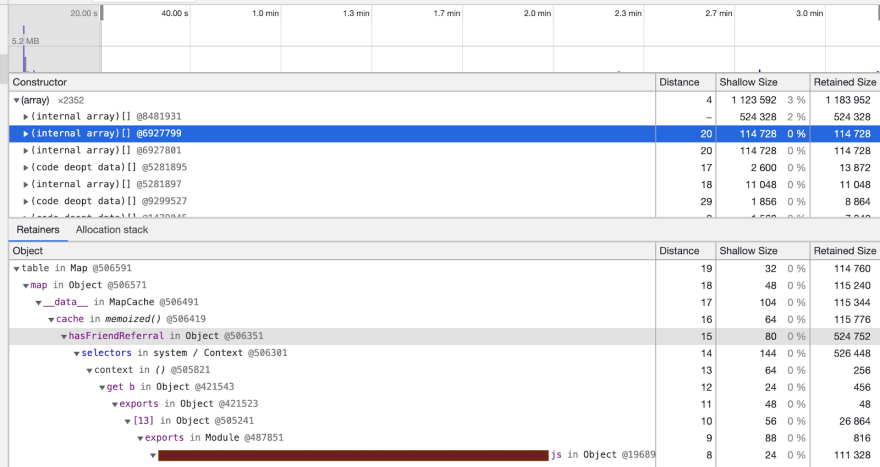
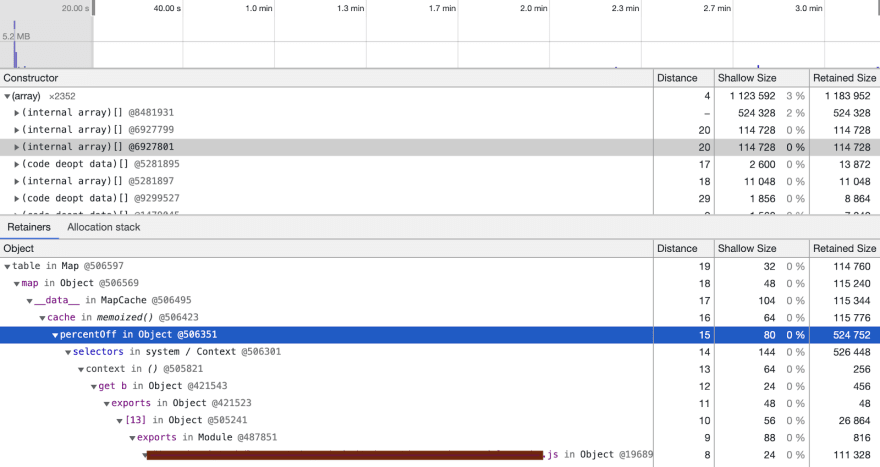
What we immediately found was an issue with how we used Lodash, and more specifically the memoize() function.
We were handing unique keys each time and thus creating a new instance of the function every single time. So the internal Map would just keep growing. This counts as a leak.
The 2 culprits were found in the below snapshots, note the first internal array is the “node_modules”, and removed from code.
There was also a 3rd instance of this which was actually worse than the others, so this was also removed.
Removing the memoize function fixed these particular problems.
However the overall problem on production remained and the boxes continued to leak memory in the same way.
At this point we felt it might be useful to get more insights to the leak on production.
Plan B - More production visibility
We decided there were 2 ways to gather production box information.
1. Prometheus
Add Prometheus to the box - it is fantastic at capturing all kinds of low level metrics and might prove insightful at helping us locate the source of the leak.
The idea is we add a /metrics endpoint for the app which exposes certain stats, and we can gather and display them on our Grafana.
This is an example of the /metrics output.
With the Koa library, the change looks something like this, using the popular library prom-client.
Once this change was live we were able to analyse the results.
One of the most interesting metrics is called "NodeJS heap space size used". It lets you examine the performance of different memory spaces.
const metricsRouter = new Router();

metricsRouter.get('/metrics', async (ctx) => {
  ctx.set('Content-Type', register.contentType);
  ctx.body = await register.metrics();
  ctx.status = 200;
});

router.use(metricsRouter.routes());
What we found was that the "old space" is where the leak resides.
To demonstrate the difference in memory space here is the "new space" in a period of time.
And here is the same period of time with the "old space". A clear leak.
What this suggests is that we have objects surviving being garbage collected, the top 2 reasons for this is that we have pointers to other objects still in memory or we have raw data being continually written to. Both those reasons are typically caused by bad code.
2. Heapdump
Using the heapdump package we can capture and download snapshots from production, put them into the Chrome memory profiler locally and try to locate the source of the leak.
The idea is that the real box memory would contain the real leak, whereas local attempts to replicate had mostly failed to be consistent.
There were 3 problems with this, most come from the fact we use AWS ECS Fargate on production distributing requests across multiple containers.
Problem #1
We could not connect directly to a running box via terminal (ala a "docker exec" like command) as they are not exposed this way. Any "ECS" command is run in a new container and therefore would be useless at providing a memory snapshot we can use.
Problem #2
Given "Problem #1" we knew we had to go with exposing a URL to download the snapshot. However we could not reliably hit the URL of the same box. The load balancer would keep moving us around boxes (we have not enabled sticky sessions) so we would take memory dumps of the different boxes which would prove useless once compared.
Problem #3
Building a memory snapshot uses a heck of a lot of CPU and memory in itself. It is a very intensive task. So we had to make sure any URL that exposed this ability was behind some sort of authentication.
Solution
We added a url to the website and added authentication via time sensitive 1-way hash to ensure nobody could hit the page without our permission.
The process to download the memory heap snapshot file was below.
-
Generate a valid hash locally, its tied to the start of the hour (I have omitted the real value)
node -e "const moment = require('moment'); console.log(crypto.createHmac('sha256', 'secret-key').update(JSON.stringify({ date: moment.utc().startOf('hour').toISOString(), value: '[obfuscated]' })).digest('hex'));"
Hit website url with
/heapdump?hash=<hash>to download the file
The same hash code is run on the server and as long as they match the current memory snapshot is taken, this took care of Problem #1 and Problem #3.
The snapshot filename is the ECS task-id (more details on how to capture that in AWS docs here), so hitting it a couple of times should get around Problem #2 and generate profiles from the same box.
Analyse production snapshots
We followed the same process as with our local profiling i.e. hitting a box then waiting a couple of minutes to hit it again. Then comparing the memory allocated between them.
The 2 tasks profiled are shown in google dev-tools below.
The good news is that the snapshots highlight the clear signs of a leak. The memory always starts around 50mb, after 10-15 minutes has moved to 85mb then another 10-15 minutes later is 122mb. Generating the snapshot will incur a memory cost, but it should not be that much.
This is not something we were able to see locally.
By looking at the “objects allocated” between the snaps with the large gaps (see below) we found that an internal array was increasing by 4-5% (note: the top item is the snapshot itself, it requires memory to generate the snapshot).
This applies to the retained memory, which is important as it lets us know how much memory would be freed if this object was garbage collected.
As each entry was from a different library we decided it was possibly a NodeJS issue, perhaps maps/arrays were not as optimised in v10 as in v14?
Upgrading NodeJS
Upgrading the version of NodeJS that the website uses was fairly straightforward as we were not using any deprecated features from v10. We had to update the Docker image, CircleCI config and our local NVM config. All of which to the latest at the time, which was v14.16.
The results were immediate..instead of a continual steep incline up, the memory remained stable, see below.
The old space in the heap, which was previously the root cause, was looking much better after the upgrade too.
So that was it ?? ! We profiled production, found the root cause, applied a fix and since that day the website's memory usage has been stable.
Lessons learned
We learnt a lot through this journey, here we detail a couple of points:
- When dealing with a leak local profiling is a good place to start, but don’t pin all your hopes on finding the cause there
- Use prometheus to locate the memory space of a memory leak
- Compare memory heap dumps in google dev-tools to locate the source of the memory leak
- If you are considering collecting production memory snapshot, be aware of what your infrastructure can or cannot do
- Keep your dependencies up to date, if you don't eventually there will be a price to pay
We hope you enjoyed this post.
If you think you would be interested to work with the engineering department at Fiit check out our careers page here to see what's available.
Thanks
This content originally appeared on DEV Community and was authored by Craig Taub
Craig Taub | Sciencx (2021-05-20T09:40:58+00:00) How we resolved a memory leak on our website. Retrieved from https://www.scien.cx/2021/05/20/how-we-resolved-a-memory-leak-on-our-website/
Please log in to upload a file.
There are no updates yet.
Click the Upload button above to add an update.


