This content originally appeared on Level Up Coding - Medium and was authored by Alok Awasthi
“Testers don’t like to break things; they like to dispel the illusion that things work.” — Kaner, Bach, Pettichord
First of all, let us start with a little bit about the tool Jmeter. It is an Apache test tool for analyzing and measuring the performance of applications, software services, and products. It’s open-source software developed entirely in Java that can be used to test both web and FTP applications. Basically, you can twist and turn your product into any kind of situation you like. A perfect tool for getting the data you require to proceed or to put a halt to the product.
In this article, I am going to show you how you can proceed with the testing and what you should be doing for situations where the APIs you are testing are heavy or the number of requests is very high.
I guess before starting with the blog you would have already installed the tool. If not, you can go through the steps otherwise just scroll down a little and continue with the blog. The following steps are for mac users. It may differ a little for windows. You can check any installation video on youtube.
Steps to install and open Jmeter
Step 1: Check if java is installed. Write the following command on the terminal. If it is not installed then first install it and then continue from here.
java -version
Step 2: Download Jmeter from the link: https://jmeter.apache.org/download_jmeter.cgi
Remember to download the latest version from Binaries and not from the Source as there is a jar file missing here. Download the zip file.
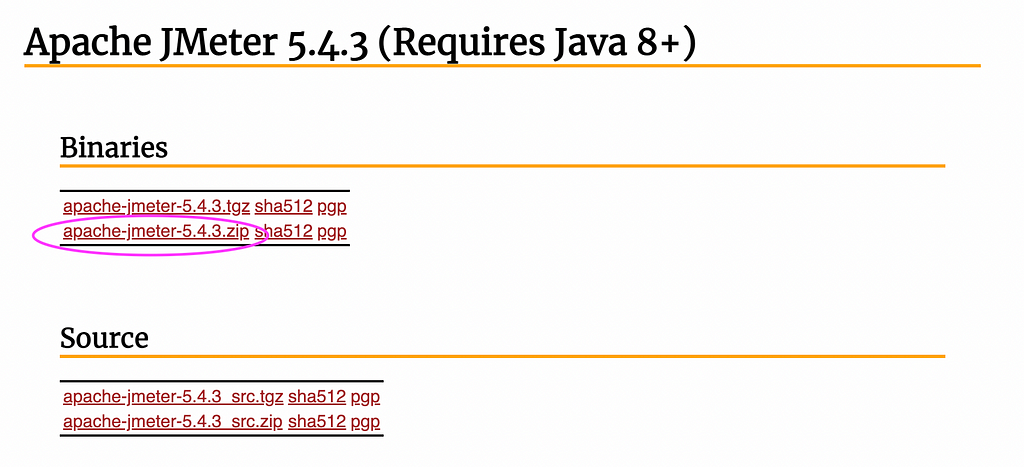
Step 3: Unzip the file and move to wherever you store your tools
Step 4: Open up the terminal. Go into the bin folder inside the unzipped apache-jmeter folder.
cd <Location of the folder>
Now write the following command and Jmeter will start running.
sh jmeter.sh
Continuing with the working of Jmeter
Now let’s start with our first test plan (You can use whatever naming convention you want).
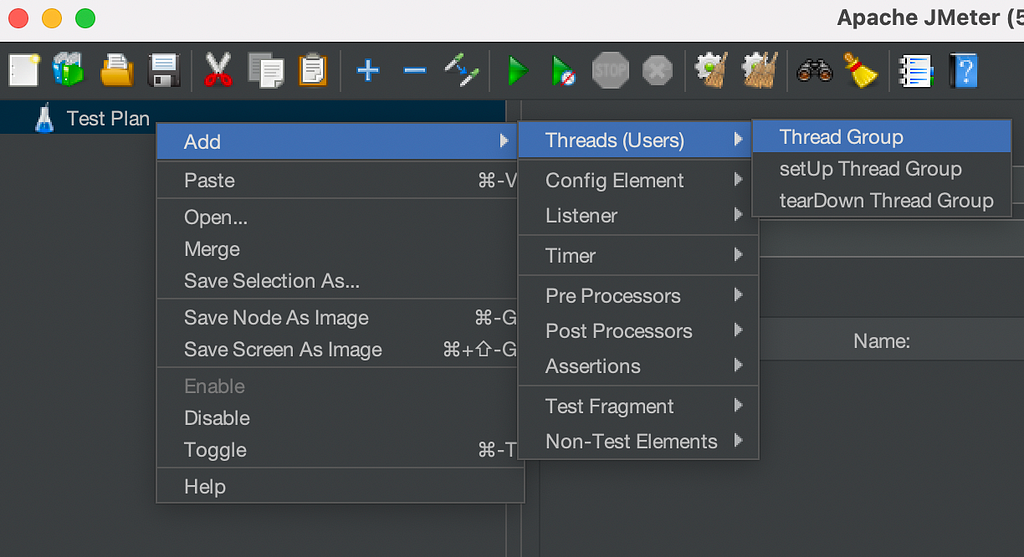
Step 1: First create a thread group.
Right click on Test Plan -> Add -> Threads (Users) -> Thread group
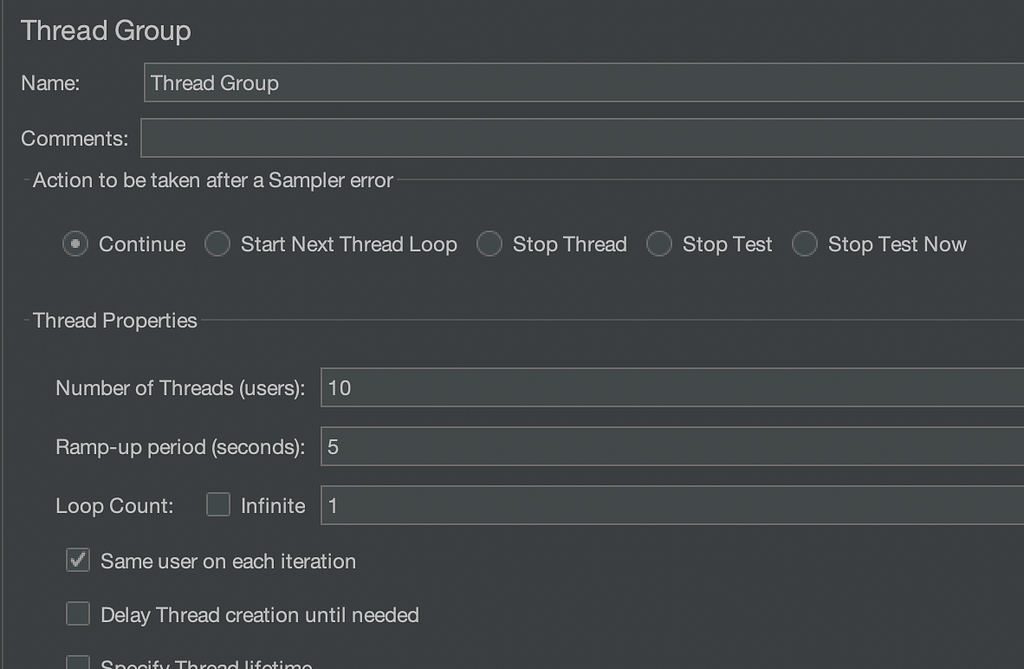
- Number Of Threads: It represents the total number of virtual users performing the test script execution.
- Ramp-Up Period (in seconds): It indicates how long it will take JMeter to reach the maximum number of threads. For example, if you have 10 users and a 5 second ramp-up time, JMeter will take 5 seconds to start all 10 threads, adding 2 threads per second.
- Loop Count: It’s the number of times the script has been run. If the loop count is 2 and the number of threads is 10, the script will execute 20 times. If the loop count is set to “forever,” new threads will continue to be created until the tests are terminated.
- Same User On Each Iteration: If you want cookies and cache to remain between Thread Group iterations then select this option otherwise don’t.
- Delay Thread Creation Until Needed: The ramp-up delay and startup delay are executed before the thread data is created if this option is checked. If this option is not selected, all of the data required for the threads is created before the test is run.
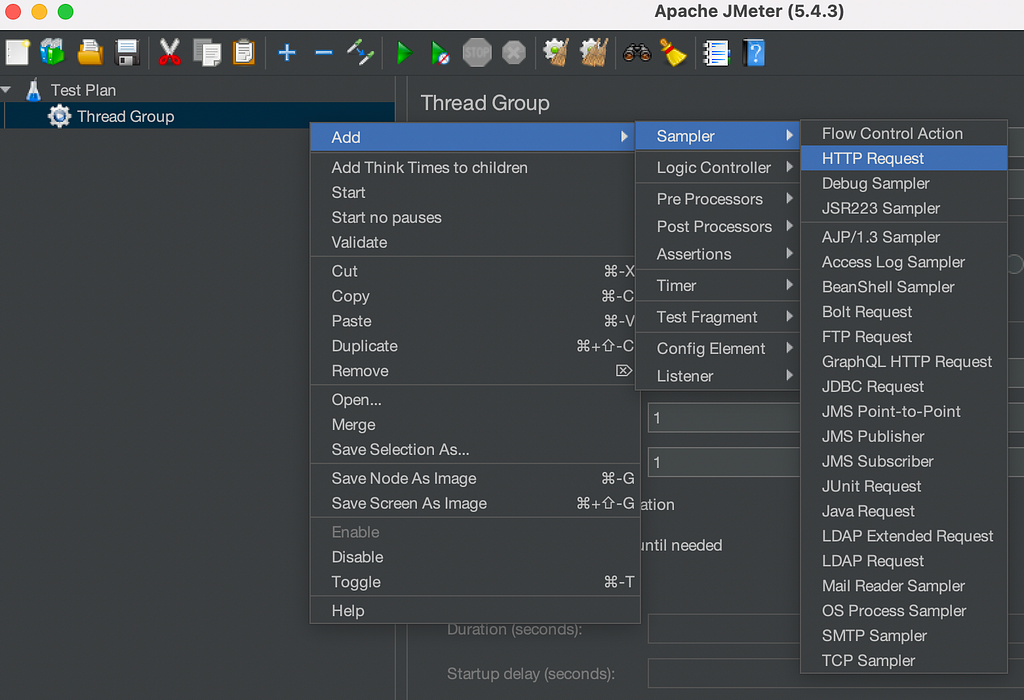
Step 2: Now, add an HTTP Request.
Right click on Thread Group -> Add -> Sampler -> HTTP Request
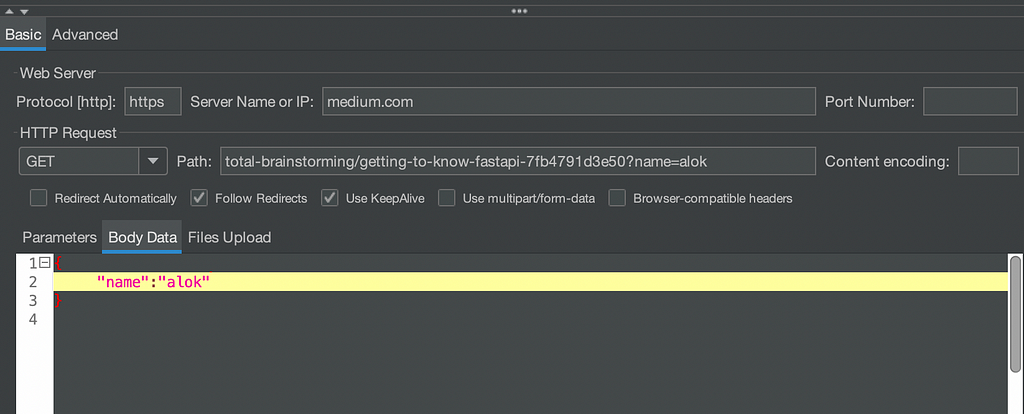
Step 3: Fill up the HTTP request. I’ll be using “https://medium.com/total-brainstorming/getting-to-know-fastapi-7fb4791d3e50” as an example.
— There are many options for the kind of request you want to make.
— Add the path in the Path section
— If there are any Parameters or Request Body you can add them below.
— If you want to add both Parameters and Body Data then you will have to add the parameters along with the path as shown in the below example (This is obviously just an example. Won’t hit the API with the parameter or request body 😅).
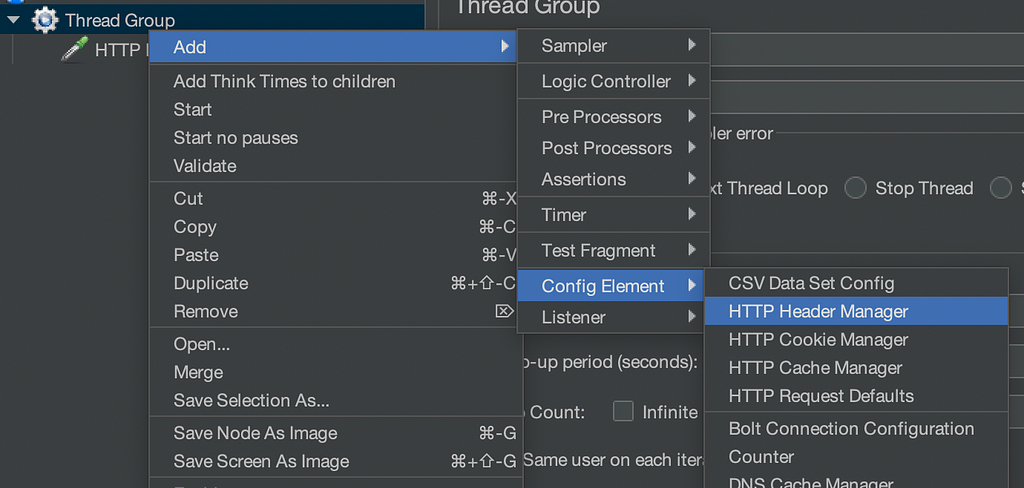
Step 4: There are some HTTP Managers like Header or Cookie Manager. If there are any headers you can add them as shown in the images.
Right-click the Thread Group -> Add -> Config Element -> HTTP Header Manager.

Step 5: Lastly, there are many listeners that can help you with checking up on the requests that you hit.
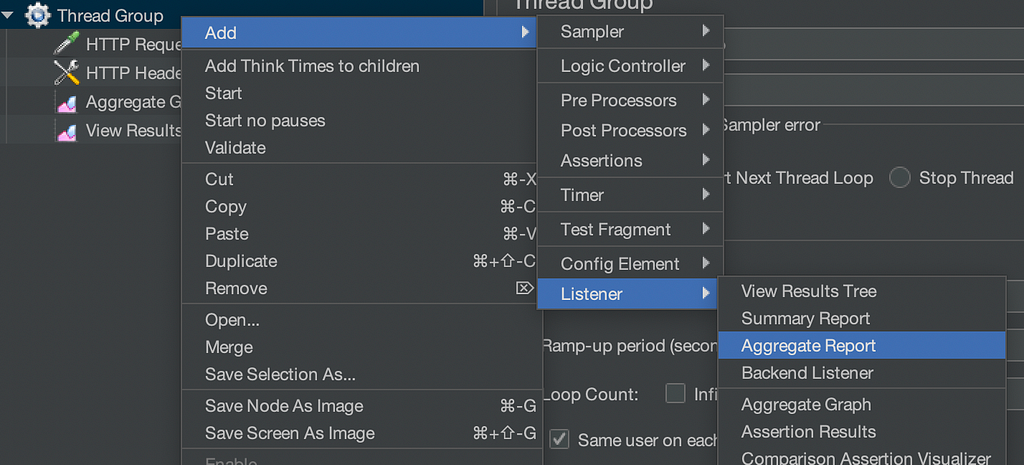
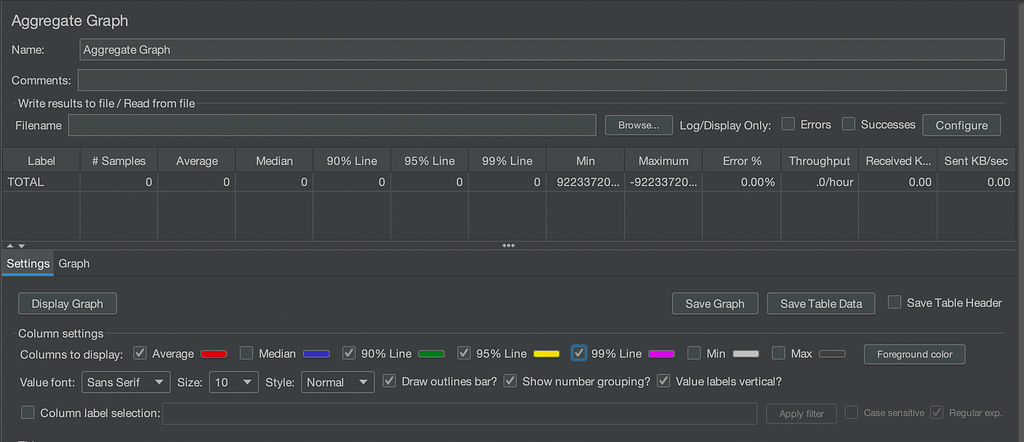
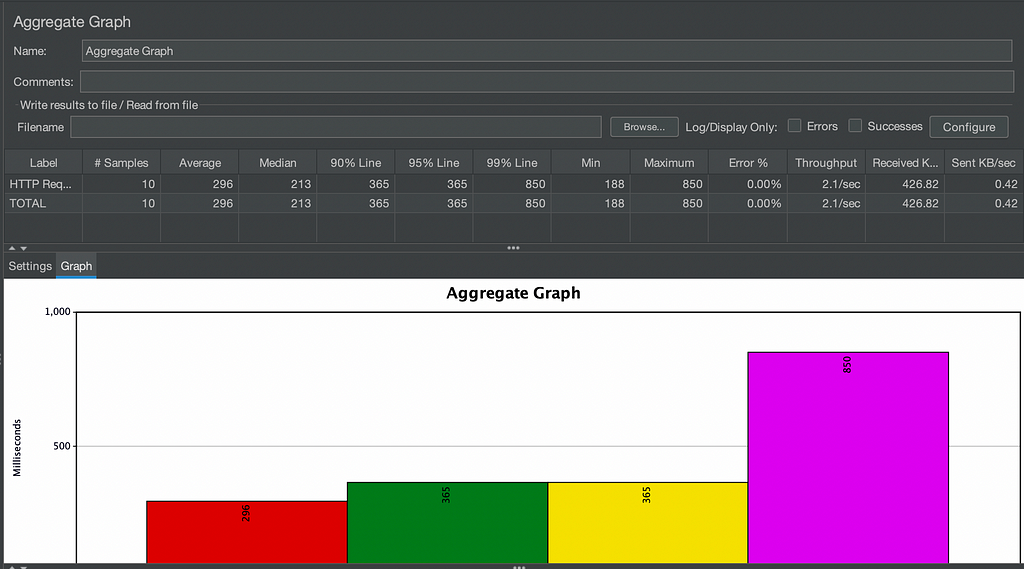
I will show you the two that I mostly use. You can play around with others but don’t worry you won’t be needing them much. The first one is the Aggregate Graph. This listener gives you all the values in a table as well as in a graph.
- #Samples: Total number of Samples.
- Average: Average Time.
- Min: This is the minimum time for a request to complete.
- Max: This is the maximum time for a request to complete.
- Error%: Number of error requests/Total number of requests.
- Throughput: Throughput is the per-second request received by the server.
- Received KB/second: This defines how many kilobytes per second are received by the Client.
- Sent KB/second: This defines how many Kilobytes per second are sent to the server.
- 90% Line: It represents that 90% of the requests were completed in the below time.
- 95% Line: It represents that 95% of the requests were completed in the below time.
- 99% Line: It represents that 99% of the requests were completed in the below time.
To display the graph, check the boxes for which you want the graph and click on Display Graph.
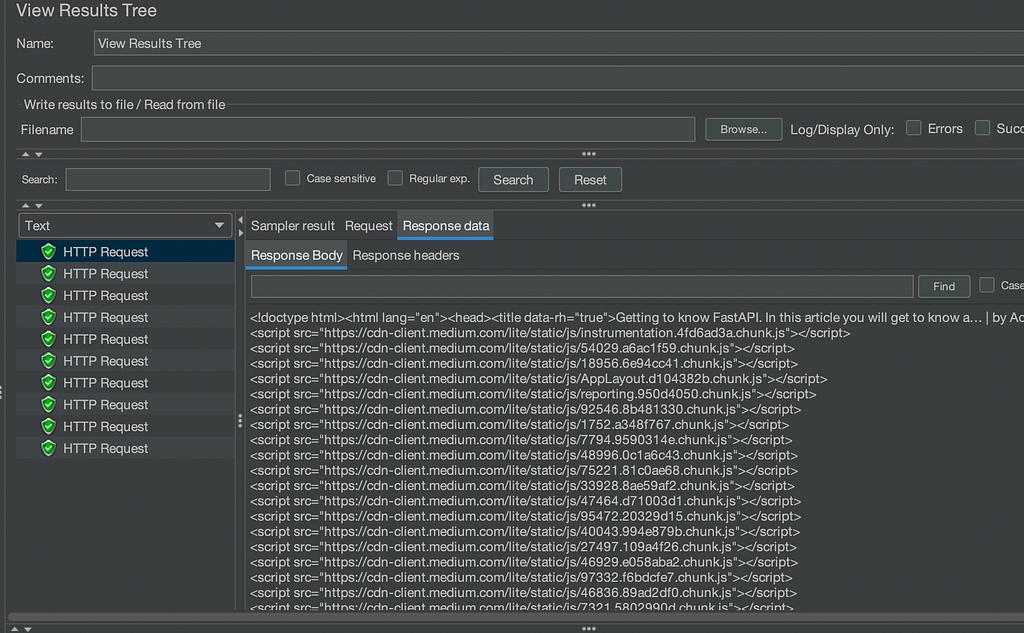
The second one is View Results Tree. This one gives you the success/failure of each request along with the response headers/data. We will see more about it after we hit a request.
Testing the Test Plan
Since now we have set up the test plan, we will go ahead and start with the test and check out the results in the listener.
First, let’s see the Aggregate Graph. Remember that the values are in milliseconds. So, 99% of the requests were completed within 0.85 seconds. Now, if anyone wants to see whether the code requires optimization or not they can check these results and make a decision.
The next one is the View Results Tree, where you check the response body and response headers for each of your requests. This helps when you have some failed requests and you want to know the reason.
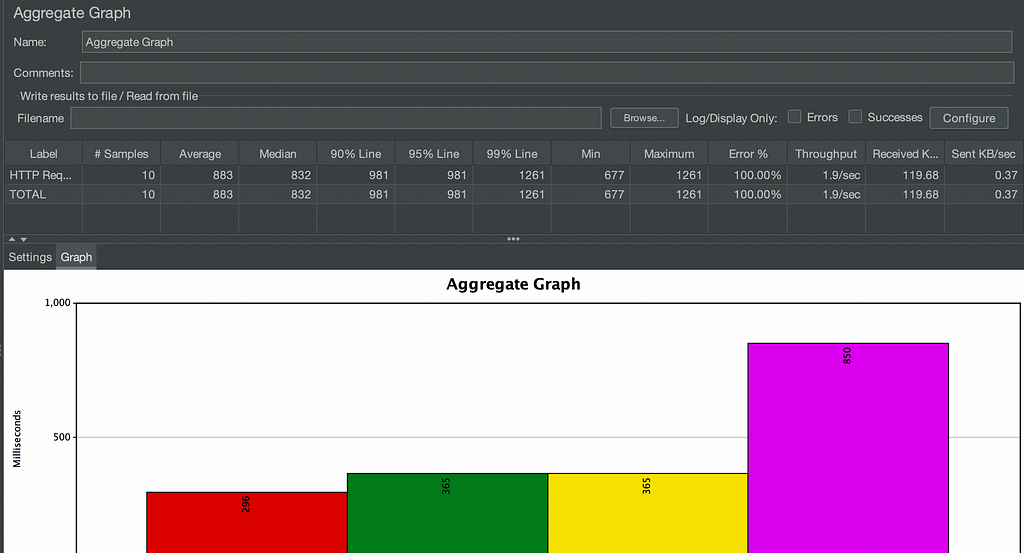
Now, we will generate some error results by putting the wrong URL. Before starting with this clear out the previous results ( ⌘+E ).
Obviously, error% will be 100%
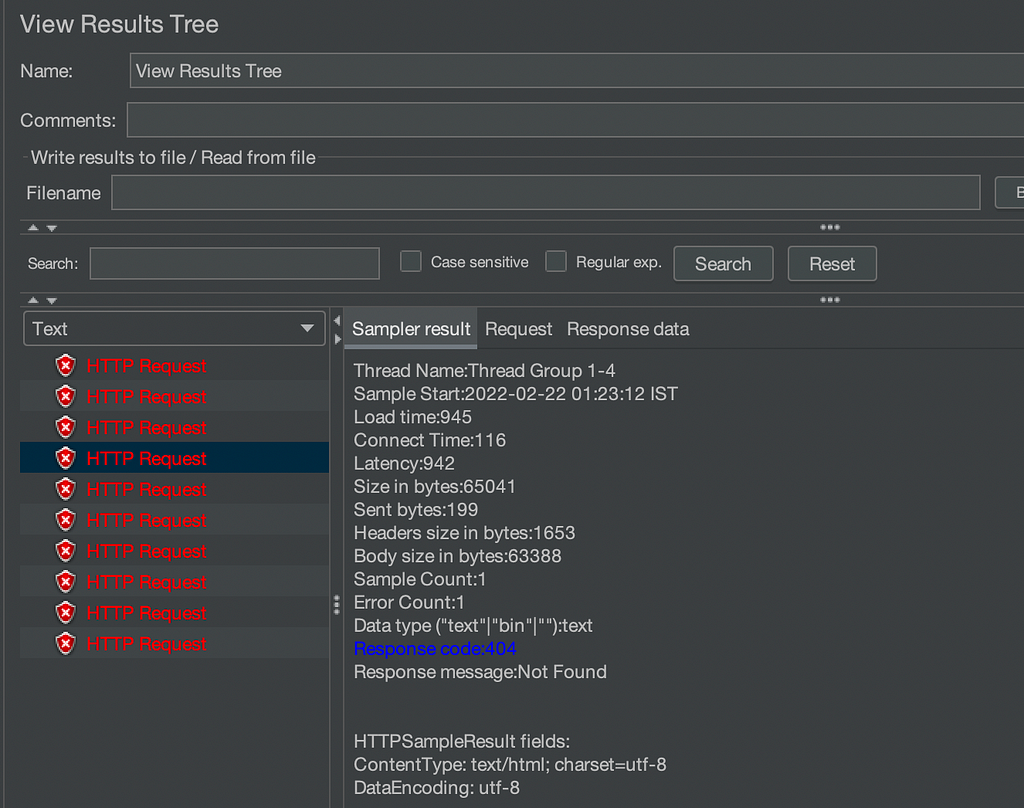
This will give you some basic reasons like Not Found. You can also check whether your request started giving an error after a certain period or if some requests were getting errors in between. You can also check the latency or size of each and every request.
Coming on to the Load Testing
So, when you started Jmeter on your terminal, you must have seen the statement of not using GUI mode for Load Testing. That statement is very true having the first-hand experience myself.
The heap memory of Jmeter is finite so when you do Load Testing in the GUI mode it is not able to hold your APIs and start giving false error results which obviously you don’t want.
This also stops the app for a while, so you can either restart it or wait for it to start working again.
Also, there are sometimes significant differences in the request completion time shown in GUI vs Non-GUI mode (it might be due to some overheads or something else).
So, now let’s start with the Non-GUI mode. And don’t worry whatever you did above is not in vain.
Step 1: Save the Test Plan. If you have no issues then save it in the bin itself with a new folder there. Just makes it a little easier. I have saved the Test Plan in the bin folder as “/Test/Test_Plan”. Make sure you are saving the whole Test Plan and not just one of its elements. If not sure, just click on
File -> Save Test Plan as
Step 2: Go to the terminal and open a new tab ( ⌘+T ). Again, go to the bin folder. Remember to do this in a new tab/window so that you do not close Jmeter GUI mode.
Step 3: Type the following command. Change the file names wherever required.
sh jmeter.sh -n -t Test/Test_Plan.jmx -l Test/Test_Plan.jtl
-n: It specifies to run in Non-GUI mode
-t: Name of JMX file that contains the Test Plan
-l: Name of JTL(JMeter text logs) file to log results. Basically, your listeners.
-j: Name of JMeter run log file
It gives a little summary report. Now check the folder a Test_Plan.jtl file has been created

Step 4: Let’s go back to GUI.
- Open Jmeter GUI mode (Told you not to close it).
- Open any of the Listeners
- Make sure you have removed any other results still there.
- Click on browse and select the file.
And there you go, all your results. This doesn’t store the Response Data/Headers.
Step 5: Now, if you want to change some of the values. Like, now you want 100 threads or you want to change your HTTP request a little, you can easily just change the values in GUI mode and save it. Go to the terminal for Non-GUI mode and give the command again.
Change the .jtl file name before starting with the next test or delete the previous one or else the results will be appended to the previous one.
Make sure that whenever you do Load Testing for heavy APIs or even if the API is light but the number of requests is high, Non-GUI mode is preferred.
I hope this article can help you start with Jmeter and do all kinds of basic testing. Have fun.
GUI and Non-GUI Jmeter Load Testing was originally published in Level Up Coding on Medium, where people are continuing the conversation by highlighting and responding to this story.
This content originally appeared on Level Up Coding - Medium and was authored by Alok Awasthi
Alok Awasthi | Sciencx (2022-03-09T02:32:29+00:00) GUI and Non-GUI Jmeter Load Testing. Retrieved from https://www.scien.cx/2022/03/09/gui-and-non-gui-jmeter-load-testing/
Please log in to upload a file.
There are no updates yet.
Click the Upload button above to add an update.
