This content originally appeared on DEV Community and was authored by DEV Community
When I recently looked at our cloud costs, one thing that stuck out was our CloudWatch cost being the second highest in the list of AWS services compared to previous months. That was unusual, considering that the cost of the CloudWatch service had been negligible compared to other services.
This post will walk you through the steps I took to identify which CloudWatch service and logs were contributing the most towards the cost. Even before I started my investigation, I had an idea of what was contributing to the high CloudWatch cost. Examining the CloudWatch cost breakdown in the AWS monthly bill confirmed it. According to the bill, the increase was due to AmazonCloudWatch PutLogEvents. This is great, but I still don't know what is causing it. Next stage was to delve a little deeper into my investigation.
The PutLogEvents API Operation of AmazonCLoudWatch uploads a batch of log events to the given log stream. As a result, I knew that the CloudWatch logs were the source of the entire CloudWatch expense. But the question remained, which logs were the key contributors.
To begin my investigation, I first went to the Cost Explorer and filtered the cost by CloudWatch service and grouped it by Usage Type. From the graph below I could see that most of the CloudWatch cost was attributed to DataProcessing-Bytes in the APS2 region. The cost increase is associate to a single Region.
The next step was to identify which API operation was attributing to an increase in the data. For that, I switched to API operation, and the following is the graph.
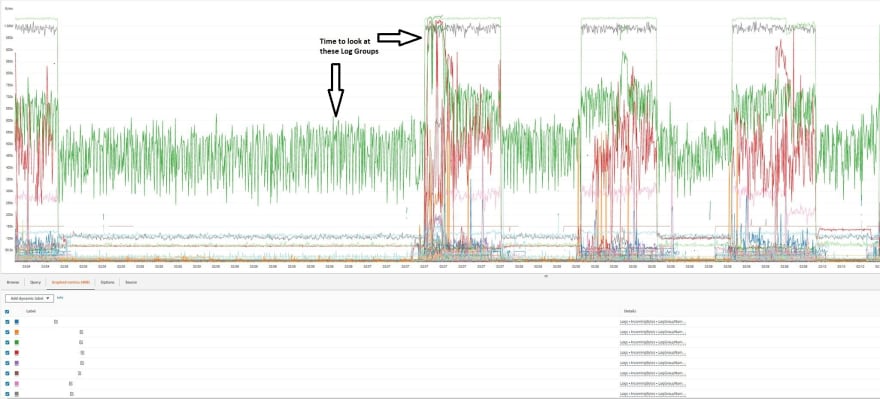
I could see from the graph that the PutLogEvents API operation is the one contributing the most to the CloudWatch cost. The same was reported by the monthly AWS Bill. We are on the right track. After determining that the usage type was Dataprocessing and the API operation was PutLogEvents, the next step was to determine which log group was ingesting the data the most. To do so, I went to the Cloudwatch dashboard and created a graph for each log group's "IncomingBytes" metric.
I could now see how much data was been written to each log group by looking at the IncomingBytes LogGroups graph above. From the graph, there are four log groups that stand out. The first is a generic log group (green graph), whereas the other three are related to a specific service.
During weekdays, two out of three specific service log groups ingest 1MB per 5 minutes of data on average. The generic log group ingests about 0.5MB every 5 minutes on average. That's a lot of data being ingested. Now that I have this information, I can concentrate on understanding and addressing each log group with the assistance of the developers, while simultaneously reducing CloudWatch cost.
I hope this article has given you a basic approach on how to identify which CloudWatch service is costing you the most. Also look at your Cloud cost holistically and make it a habit to analysis your Cloud cost on regular basis.
Thanks for reading!
If you enjoyed this article feel free to share on social media 🙂
Say Hello on: Linkedin | Twitter | Polywork
This content originally appeared on DEV Community and was authored by DEV Community
DEV Community | Sciencx (2022-03-14T04:01:37+00:00) Why Is My AWS CloudWatch Service Cost So High?. Retrieved from https://www.scien.cx/2022/03/14/why-is-my-aws-cloudwatch-service-cost-so-high/
Please log in to upload a file.
There are no updates yet.
Click the Upload button above to add an update.


