This content originally appeared on Telerik Blogs and was authored by Ifeoma Imoh
In this post, we will build a simple React application that shows how to use the Web Audio API to extract audio data from an audio source and display some visuals on the screen. It can be a good alternative when no video is available to engage users—including applications related to music, podcasts, voice notes, etc.
Audio visualization uses graphical elements to display to listeners the contents of the sound they are hearing. It can be a good alternative when no video is available to engage users. Some common use cases are applications related to music, podcasts, voice notes, etc.
Web browsers have evolved tremendously, providing us with advanced tools such as the Web Audio API. This API exposes a set of audio nodes existing within the audio context designed for audio manipulation, filtering, mixing and so on. Each audio node handles its own specific audio manipulation concern, and nodes can be chained together to form a simple or complex audio manipulation graph as needed.
In this post, we will build a simple React application that shows how to use the analyzer node to extract audio data from an audio source and display some visuals on the screen. This should be fun!
Project Setup
Create a React application using the following command:
npx create-react-app audio-visualizer
The Audio Graph
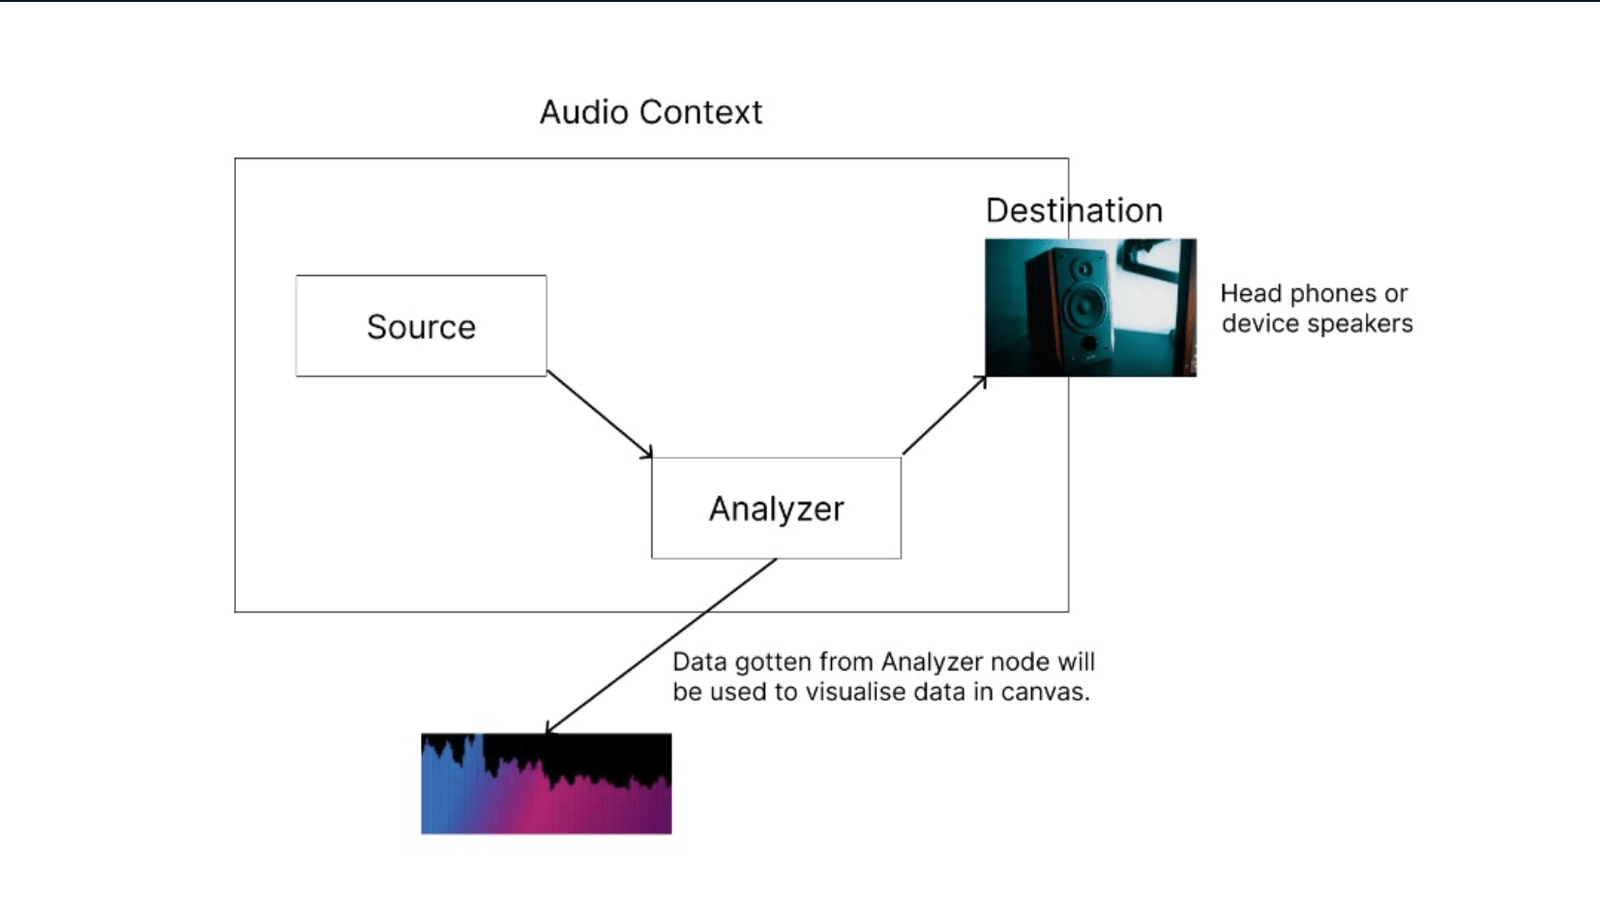
As mentioned earlier, the Web Audio API is graph-based, providing a set of audio nodes that can be chained together to manipulate audio. In a web application, the structure of an audio graph can be tailored to the unique use case. Before we proceed, let’s take a look at the diagram below that shows our mini audio graph:

The source node is usually the starting point of any audio graph, referring to where the audio data stream is obtained. There are several ways to do this, including using the user’s microphone, fetching the audio file over the network, using an oscillator node, or loading the audio file via a media element (an audio node). More information regarding audio sources can be found here.
Next in line is our setup analyzer node, which receives the output of the audio source. This node doesn’t modify the audio file; it only extracts time and frequency domain data from the audio stream, which will be used to visualize the audio on the canvas.
Finally, the analyzer node is connected to the destination node, which represents the speaker, and this can be a headphone or the speaker built into the device.
Note that the analyzer node does not need to be connected to the speaker for our setup to work. While our primary focus is visualization, we will connect the analyzer node to the speaker to improve the user experience by allowing the user to listen to the sound while seeing the visualizations.
Building the App
Let’s head over to our src/App.js file and add the following to it:
import "./App.css";
import { useRef, useState } from "react";

let animationController;

export default function App() {
  const [file, setFile] = useState(null);
  const canvasRef = useRef();
  const audioRef = useRef();
  const source = useRef();
  const analyser = useRef();

  const handleAudioPlay = () => {};
  const visualizeData = () => {};

  return (
    <div className="App">
      <input
        type="file"
        onChange={({ target: { files } }) => files[0] && setFile(files[0])}
      />
      {file && (
        <audio
          ref={audioRef}
          onPlay={handleAudioPlay}
          src={window.URL.createObjectURL(file)}
          controls
        />
      )}
      <canvas ref={canvasRef} width={500} height={200} />
    </div>
  );
}
In the code above, we start by importing the useState and useRef hooks. Next, we define a variable called animationController, which will be explained later.
In our App component, we created a state variable called file and its setter function called setFile, which will be used to get and set the audio file selected
by the user from their computer.
Next, using the useRef hook, we defined four refs: canvasRef and audioRef are bound to the canvas and audio elements included in the returned JSX. The analyser ref will hold our
analyzer node, while the source ref will hold the source node.
Notice that we didn’t discuss the two main functions: handleAudioPlay and visualizeData. Before we update these functions, let’s see how users can interact with our app, the
underlying function calls, and at what point these functions are called.
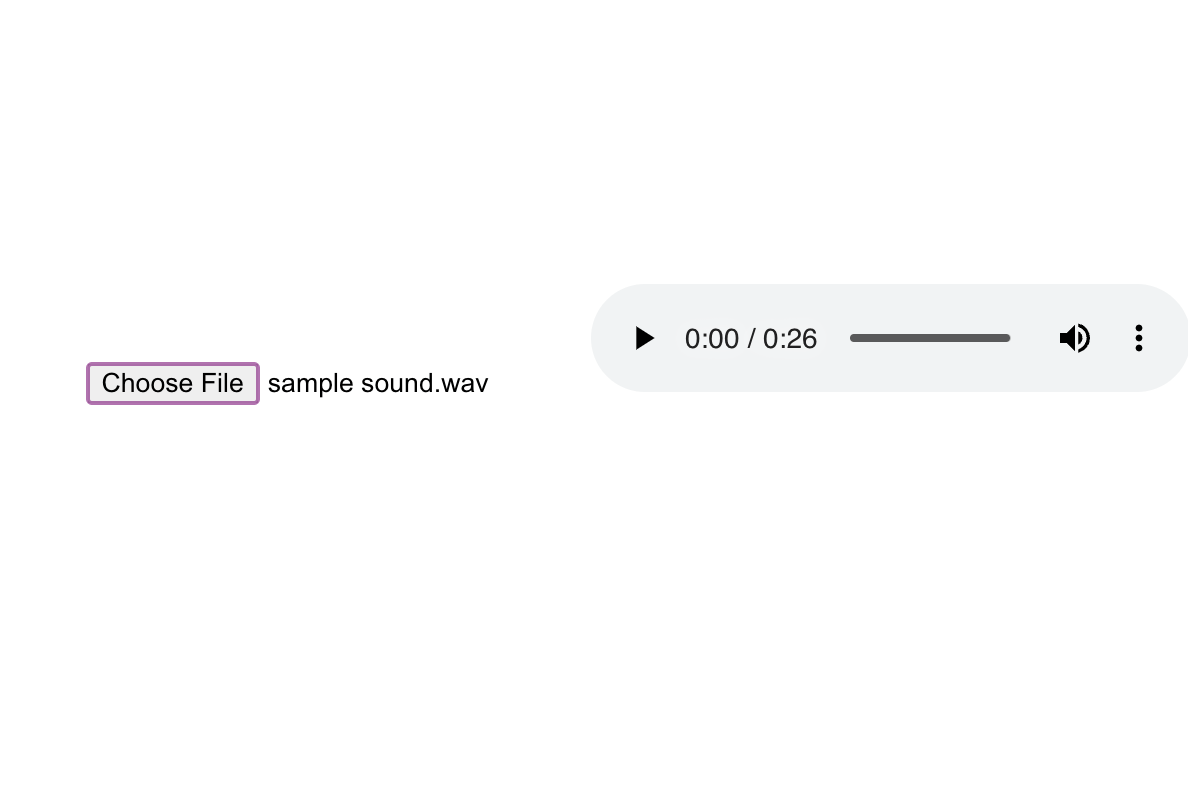
First, the user selects a file using the file picker, which triggers the function bound to its onChange event, which invokes the setFile setter function to store the audio file. When this
happens, the application re-renders. The <audio/> element, which is conditionally rendered based on the availability of a file, should now be visible, as seen below.

When the user clicks on the play button on the <audio/> element, the playback begins, and its onPlay event fires, which invokes our handleAudioPlay function bound to it. Let’s update this function in our App.js file like so:
const handleAudioPlay = () => {
  let audioContext = new AudioContext();
  if (!source.current) {
    source.current = audioContext.createMediaElementSource(audioRef.current);
    analyzer.current = audioContext.createAnalyser();
    source.current.connect(analyzer.current);
    analyzer.current.connect(audioContext.destination);
  }
  visualizeData();
};
This function starts by creating an instance of the AudioContext() class. With our audio context created, we create our source, analyzer and destination nodes.
Because the source node represents the entry point into our audio graph, we first check if it has been created previously, and this is done because only one source node can be created at a time from an <audio> element
on a webpage. We want to avoid re-creating a source node to prevent our program from crashing every time we invoke the handleAudioPlay function.
If the source node does not exist, we construct the audio graph by doing the following:
- We first create the source node and store it in the
sourceref using thecreateMediaElementSourcemethod on theaudioContext, and it receives the<audio>element as its parameter. - Next, we create our analyzer node using the
createAnalysermethod on theaudioContext. - All audio nodes have a
connectmethod that allows them to be connected/chained to one another. We connect the source node to the analyzer, and then as an optional step, we connect the analyzer node to the speakers/destination node.
Finally, we call the visualizeData method, which we are yet to update. Let’s update the content of this function.
const visualizeData = () => {
  animationController = window.requestAnimationFrame(visualizeData);
  if (audioRef.current.paused) {
    return cancelAnimationFrame(animationController);
  }
  const songData = new Uint8Array(140);
  analyzer.current.getByteFrequencyData(songData);
  const bar_width = 3;
  let start = 0;
  const ctx = canvasRef.current.getContext("2d");
  ctx.clearRect(0, 0, canvasRef.current.width, canvasRef.current.height);
  for (let i = 0; i < songData.length; i++) {
    // compute x coordinate where we would draw
    start = i * 4;
    //create a gradient for the  whole canvas
    let gradient = ctx.createLinearGradient(
      0,
      0,
      canvasRef.current.width,
      canvasRef.current.height
    );
    gradient.addColorStop(0.2, "#2392f5");
    gradient.addColorStop(0.5, "#fe0095");
    gradient.addColorStop(1.0, "purple");
    ctx.fillStyle = gradient;
    ctx.fillRect(start, canvasRef.current.height, bar_width, -songData[i]);
  }
};
In the code above, visualizeData starts by invoking the function provided by the browser—requestAnimationFrame to inform it that we want to perform an animation. Then we feed it
visualizeData as a parameter.
Internally, requestAnimationFrame registers visualizeData in a callback queue of functions that will be called each time before the screen is repainted which is usually 60 times every second
(can vary based on the viewing device).
The call to requestAnimationFrame returns the id used internally to identify the visualizeData function in its list of callbacks. This is what we store in the animationController variable we created earlier.
Next, we check if the audio file is still playing since we only want to display visuals when it is. If it isn’t playing either because the user paused the audio or the audio file has ended, we call the cancelAnimationFrame function and pass the id of the visualizeData function, which we stored in the animationController. As a result, visualizeData is no longer called and
therefore removed from the list of callbacks called by the browser before a repaint.
Next, we create a typed array of size 140 and store it in a variable called songData. Each entry in this array is an unsigned integer having a max size of 8 bits (1 byte). We used a typed array over a normal one because
our analyzer node will be reading raw binary data in an array buffer from the source node internally, and typed arrays are the recommended option to manipulate the contents of array buffers.
We use 140 for the size of our Uint8 array because we only need 140 data points from our audio file in our app.
Next, to fill our typed array with the audio data on the analyzer node, we invoke one of its methods—getByteFrequencyData, and pass the typed array to it as its parameter. Internally based on the playback state of
the audio file, getByteFrequency extracts frequency domain data from the audio file’s time domain data, a process known as Fast Fourier transform. Based on this, it fills our typed array with only 140 data points
from the extracted audio data.
Now we have the audio data stored in the typed array, and we can do whatever we want with this data. In our case, we will draw a bunch of rectangles on our canvas. First, we created a variable called bar_width, which represents
the width of a rectangle. Next, we created a variable called start, representing the x-coordinate on the canvas which will be computed to draw a single rectangle.
To begin drawing, we prepare our canvas context for 2d rendering. After that, using the clearRect() method, we clear the contents of the canvas to get rid of previous visuals. We then loop over the audio data in the
songData array, and on each iteration, we do the following:
- We compute the x-coordinate where we want to draw the rectangle and store it in the
startvariable. - Next, to make our visualizations more appealing, we create a linear gradient that spans the entire canvas and store it in the
gradientvariable. We add three color stops to the gradient using theaddColorStopmethod and set the gradient as thefillStyleon the canvas context. - Finally, we draw the rectangle on the screen using the
drawRect()function, which gets fed the following parameters:- The computed x coordinate to draw the rectangle.
- The y coordinate, which is the height of the canvas.
- The width of the rectangle, which is the
bar_widthwe defined earlier. - The height of the rectangle, which is the magnitude of the data point in the
songDataUint8 typed array in the current iteration. We converted this value to a negative since we want the rectangle to be drawn vertically.
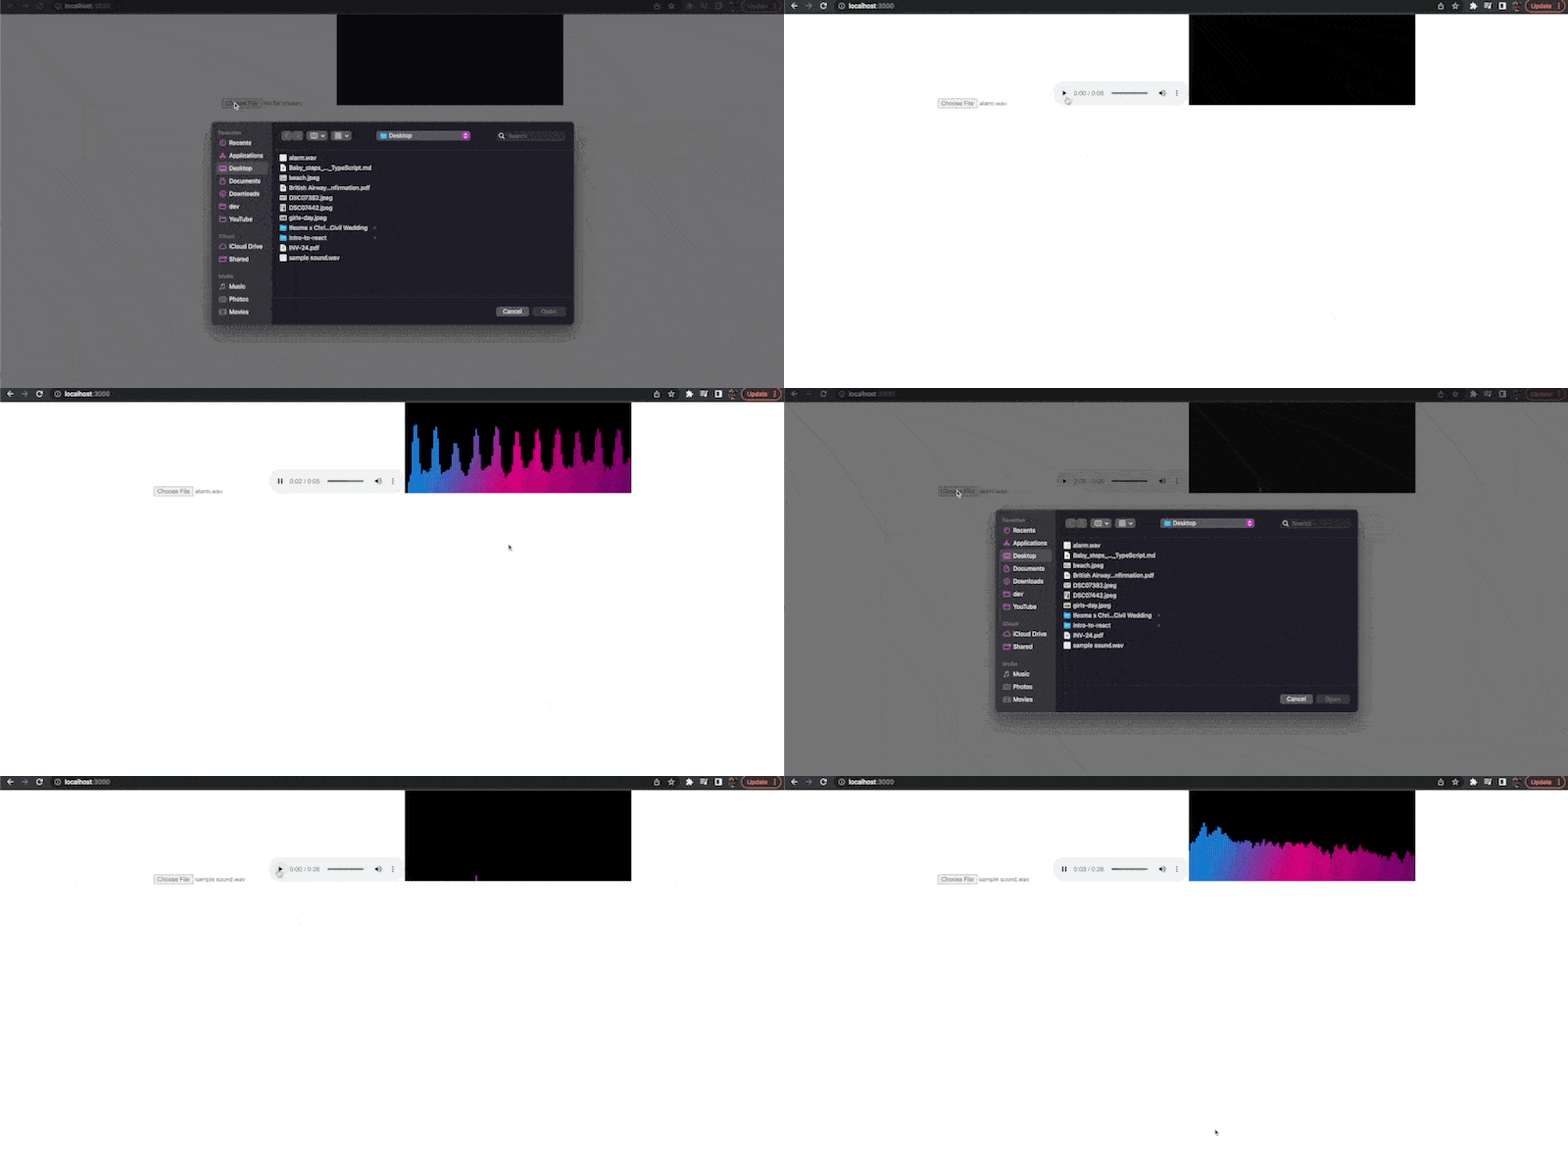
This process is repeated for every data point in our typed array. The typed array will be created and loaded by the analyzer each time visualizeData is called by the browser as scheduled using the requestAnimationFrame function to create the illusion of the animation on the canvas rendered on the screen.
Now we can start our application on http://localhost:3000/ using the following command:
npm start

Conclusion
The Web Audio API has redefined audio manipulation capabilities inside the browser and has been made to meet the audio requirements for modern applications. Several libraries have been built on this API to simplify its integration into web applications. This article provides an overview of what the API supports and what can be accomplished with it.
This content originally appeared on Telerik Blogs and was authored by Ifeoma Imoh
Ifeoma Imoh | Sciencx (2023-03-02T14:51:04+00:00) Adding Audio Visualization to a React App Using the Web Audio API. Retrieved from https://www.scien.cx/2023/03/02/adding-audio-visualization-to-a-react-app-using-the-web-audio-api/
Please log in to upload a file.
There are no updates yet.
Click the Upload button above to add an update.
