This content originally appeared on HackerNoon and was authored by Kinetograph: The Video Editing Technology Publication
:::info Author:
(1) Melody Yu, Sage Hill School, California, USA.
:::
Table of Links
III. METHODS
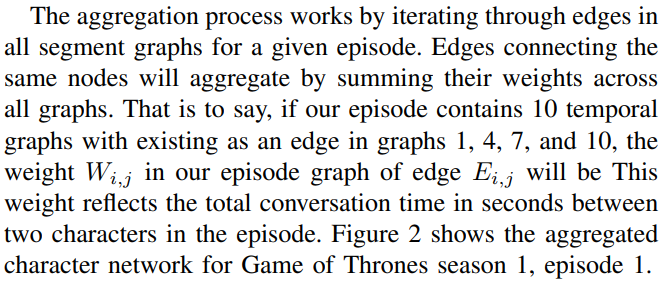
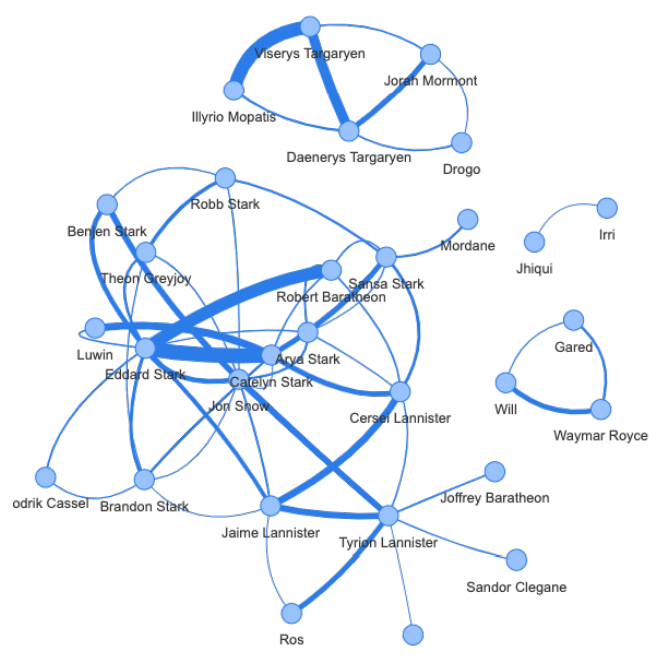
We seek to establish a relationship between IMDb ratings and network indicators for a given TV series. Each temporal graph corresponds to ten scenes from an episode, whereas each IMDb review corresponds to one episode. Thus, to study the graph metrics for each episode, we first aggregate all segment graphs in one episode into one single weighted episode graph. Then, we study metrics on the aggregated episode graph.
\ A. Segment Graph Aggregation
\
\

\
\ B. Network Metrics
\ We seek to establish a relationship between IMDb ratings and network indicators for a given TV series. Each temporal graph corresponds to ten scenes from an episode, whereas each IMDb review corresponds to one episode. Thus, to study the graph metrics for each episode, we first aggregate all segment graphs in one episode into one single weighted episode graph. Then, we study metrics on the aggregated episode graph.
\ 1) Active Nodes: Active nodes are the total number of nodes in a graph with at least one edge connecting them to another node. The number of active nodes represents the number of characters that speak during an episode. We use the number of active nodes in an episode graph to describe the complexity of the episode plot in this study.
\ 2) Network Density: A graph’s density is the ratio between the number of actual edges that exist in a graph to the maximum number of edges that the graph can have. It indicates how many of a graph’s potential connections are real connections. We define density as the following, where n represents the number of nodes and m represents the number of edges.
\

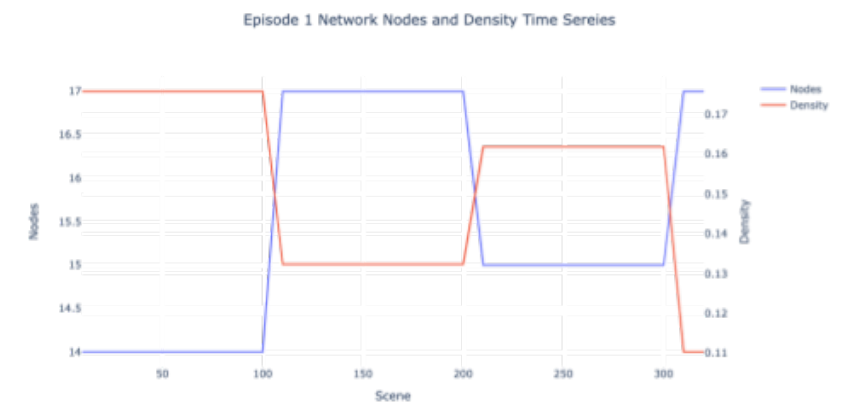
\ Figure 4 shows the time series for the number of active nodes and the network density for different segment graphs from Game of Thrones episode 1.
\ The density of the graph increases as more characters converse with one another. Characters in sparse graphs are often still connected, but the conversations are between two characters and not necessarily talk with many other characters. We use network density to measure the level of character interactions in each TV episode.
\
\ 3) Node Strength: A node’s strength is defined as the sum of the strengths, or weights, of the node’s edges. Since the edge weight in our graph indicates the time spent conversing between two characters, the strength of a character is the total amount of time spent conversing with all other characters.
\ Figure 5 shows the time series of characters with top 5 highest graph node strength from the Game of Thrones episode 1 graph.
\
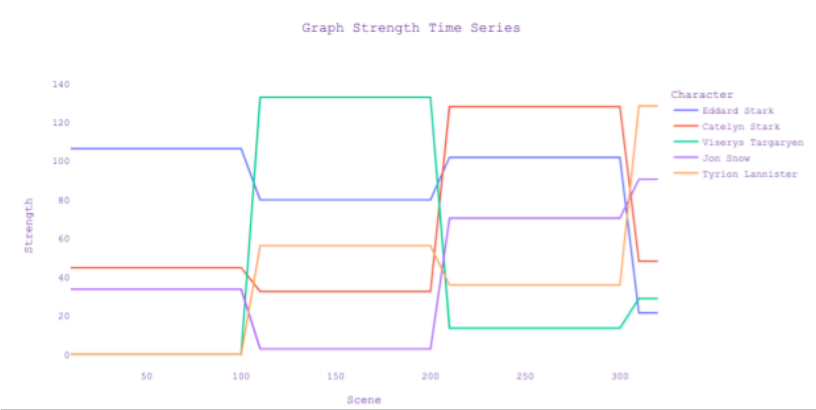
\ The maximum value of node strengths describes the total conversation time of the character who talked most with other characters during this episode. We use this metric to describe the exposure of the most active character in the episode.
\
\

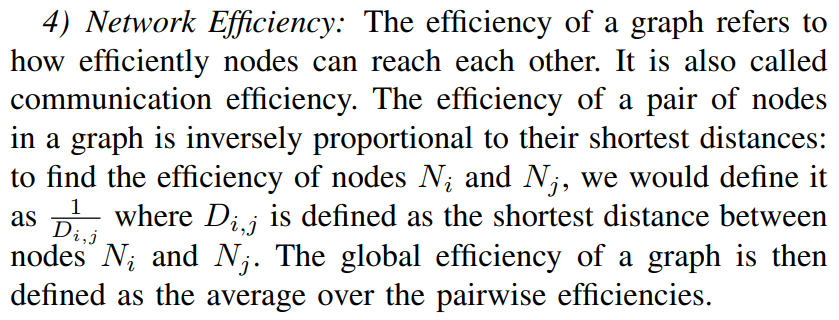
\ In this study, the TV episode graphs are usually separated into separate subgraphs, often without any connections between these subgraphs. To more accurately represent these subgraphs, we use local efficiency, calculated from the average value of a subgraph’s global efficiency.
\ 5) Network Transitivity: Network transitivity is the overall probability for the network to have interconnected adjacent nodes, revealing the existence of tightly connected communities. It refers to the extent to which the relation that relates two nodes in a network that are connected by an edge is transitive. The network transitivity is the fraction of all possible triangles present in G. It is computed as dividing total number of node triangles in the graphs by the total number of “triads” (two edges with a shared vertex)
\

\ Network transitivity is widely used to examine the level of clustering in social network analysis. In the content of character networks, high transitivity means that the network contains communities or groups of characters that are closely interacting with each other.
\ We use network transitivity to measure the extent of the complex relationship between characters, and their relation to the plot.
\ 6) Degree Centrality: In a connected graph, centrality is used to measure the importance of various nodes in a graph. In this study, we use various centrality metrics to measure the conversational interaction patterns of different characters in each TV episode.
\ Degree centrality is the simplest measure of centrality. The degree of a node is defined as the number of edges or connections that a node has to other nodes. In the context of character networks in TV shows, the degree of a character represents the number of other characters that they interact with in a given episode. Figure 6 illustrates the time series of characters with the top 5 highest degrees in the character network from the first episode of Game of Thrones.
\ A node with a higher degree than the rest of the nodes may be considered a central or pivotal character, as they have a large number of interactions with other characters. As our episode graph is aggregated from multiple segment graphs, the large number of interactions can be spread over different scenes, or concentrated in a few scenes involving many characters.
\ In this research, we will use the distribution of node degrees, including the maximum value and standard deviation, to describe the patterns of conversational interactions among the characters in a given episode.
\ 7) Closeness Centrality and Harmonic Centrality: The closeness centrality of a node in a connected graph, which is determined as the reciprocal of the sum of the shortest distances between the node and all other nodes in the graph, is a measure of centrality in a network. A node with a higher closeness centrality value is closer to all other nodes.
\

\ However, in our study, the TV episode graph is not necessarily a connected graph, as there can be some characters forming subgroups that do not interact with characters outside their subgroup. Therefore, we use harmonic centrality instead of closeness centrality to allow disconnected networks in our research. The harmonic centrality of a node u is defined as the sum of reciprocals of the shortest path distances from all other nodes to node u. Two nodes that are unreachable to each other has a distance of infinity.
\
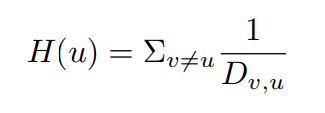
\ In our study, we use harmonic centralization distribution (max value, standard deviation) to measure the extent to which the plot of the TV episode is concentrated on a single actor or a group of actors.
\ 8) Eigenvector Centrality: While degree centrality measures the number of connections a node has, it does not take into account the influence of a node’s neighbors on its own importance. To address this, we can use eigenvector centrality, which considers the importance of a node’s neighbors in determining the node’s overall importance.
\ A node with a high eigenvector score is connected to many other nodes with high scores, indicating that it is connected to influential characters. In the context of character networks in TV shows, a character with a high eigenvector centrality is likely to be connected to characters who are also considered influential within the network. This can be useful in understanding the importance of a character within the context of the overall plot and character relationships.
\
:::info This paper is available on arxiv under CC 4.0 license.
:::
\
This content originally appeared on HackerNoon and was authored by Kinetograph: The Video Editing Technology Publication
Kinetograph: The Video Editing Technology Publication | Sciencx (2024-07-05T11:00:32+00:00) Decoding the Popularity of TV Series: A Network Analysis Perspective: Methods. Retrieved from https://www.scien.cx/2024/07/05/decoding-the-popularity-of-tv-series-a-network-analysis-perspective-methods/
Please log in to upload a file.
There are no updates yet.
Click the Upload button above to add an update.
