
This content originally appeared on Level Up Coding - Medium and was authored by Ella sheer
Profiling your Python code is crucial, but running it in an AWS Lambda complicates it, since you have no control over execution, a read-only file system and the underlying compute resources are discarded after the function execution.
In this guide, I’ll walk you through a simple and effective approach to leveraging the built-in cProfile module, integrating it with a context manager, and uploading the profiling data to an S3 bucket.
Finally, I'll show you how to generate a customized call graph to gain insights into your application's performance.

Introducing cProfile
cProfile is a powerful profiling tool that comes with Python. You can use it directly from the command line:
python -m cProfile -o output.pstats path/to/your/script.py
Profiling with a Context Manager
Let’s use a context manager to make the profiling process more convenient:
import cProfile
import pstats
from contextlib import contextmanager

@contextmanager
def profiler():
    pr = cProfile.Profile()
    pr.enable()
    try:
        yield
    finally:
        pr.disable()
        pr.print_stats()

with profiler():
    my_function() # Your function code here
Profiling inside a Lambda
I want to log into CloudWatch, so I need to work harder to integrate with our existing logger:
import cProfile
import pstats
import io
from contextlib import contextmanager

@contextmanager
def profiler(name, log):
    pr = cProfile.Profile()
    pr.enable()
    try:
        yield
    finally:
        pr.disable()

        # Create and log the profiling stats
        pr.create_stats()
        stats = pstats.Stats(pr)

        with io.StringIO() as stream:
            stats.stream = stream
            stats.print_stats(100)  # limit number of output lines to 100
            log.info("Profiling: %s, \n%s", name, stream.getvalue())


with profiler("my_function", logger):
    my_function() # Your function code here
Note how I only change the profiler code, keeping those single responsibilities.
Now your logs will show something like:
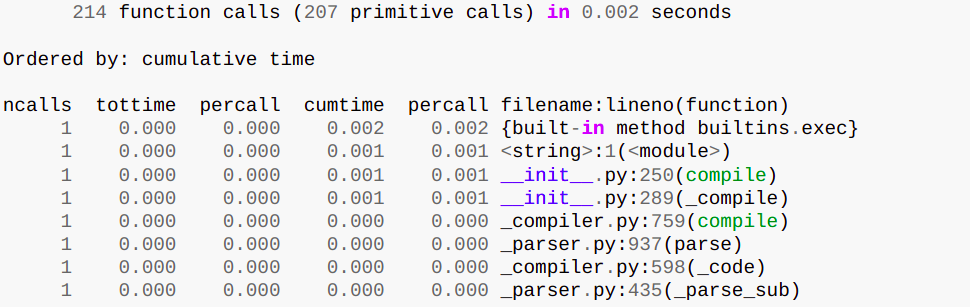
I would like to get the raw profiling, to create graphs and run different sorts and manipulation, how to retrieve it from a lambda?
Before I can upload the profiling data to S3, I need to create a new bucket and ensure that the IAM role associated with our Lambda function has the necessary permissions to access it.
Creating an S3 Bucket
- Create a bucket in AWS S3 console
- Make sure the bucket’s policy allows the lambda principal to operate:
{
    "Version": "2012-10",
    "Statement": [
        {
            "Effect": "Allow",
            "Principal": {
                "AWS": "arn:aws:iam::<account_id>:role/<lambda_role>"
            },
            "Action": [
                "s3:PutObject",
                "s3:GetObject",
                "s3:ListBucket"
            ],
            "Resource": [
                "arn:aws:s3:::your-bucket-name",
                "arn:aws:s3:::your-bucket-name/*"
            ]
        }
    ]
}- Attach a policy to the Lambda role that grants the necessary permissions to access the S3 bucket:
{
    "Version": "2012-10",
    "Statement": [
        {
            "Effect": "Allow",
            "Action": [
                "s3:PutObject",
                "s3:GetObject",
                "s3:ListBucket"
            ],
            "Resource": [
                "arn:aws:s3:::your-bucket-name",
                "arn:aws:s3:::your-bucket-name/*"
            ]
        }
    ]
}
Getting the profiler output as a file on your machine
AWS Lambda environment has a read-only file system, but it will allow us to create files under the ‘/tmp’ path:
import cProfile
import pstats
import boto3

@contextmanager
def profiler(name, log):
    pr = cProfile.Profile()
    pr.enable()
    try:
        yield
    finally:
        pr.disable()

        pr.dump_stats('/tmp/output.pstats')
        boto3.client('s3').upload_file('/tmp/output.pstats', 'your-bucket-name', f'{name}-output.pstats')
At this point I download the file to local machine, so I can play with the graph parameters, and now- let’s see some visual results!
Generating a Call Graph
To generate a visual graph, We will use this great package:
apt-get install python3 graphviz
pip install gprof2dot
Once you have gprof2dot installed, you can use the following command to generate the call graph:
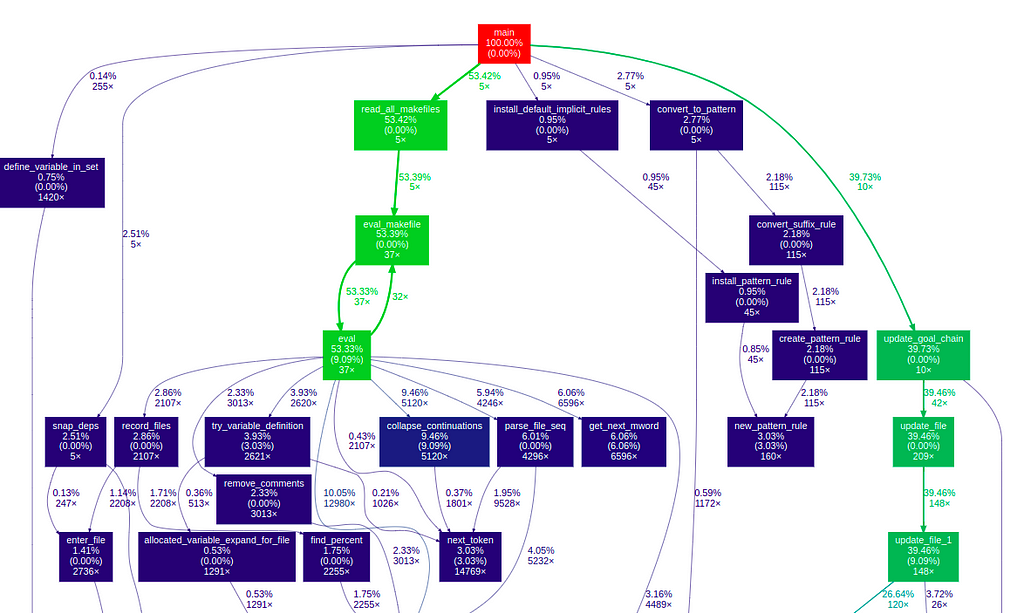
gprof2dot -f pstats my_function-output.pstats | dot -Tpng -o output.png
this command reads the profiling data from the S3 bucket, generates the DOT graph, and then renders it as a PNG image file.
After some attempts, I found myself with a more detailed command:
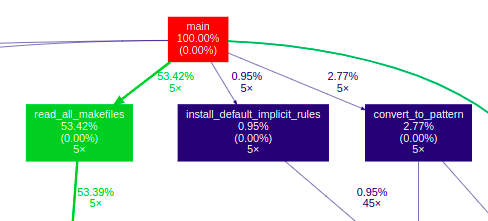
gprof2dot -n 5 -e 4 --node-label=self-time --node-label=total-time --total=callstacks -f pstats s3://your-bucket-name/my_function-output.pstats | dot -Tpng -o output_less.png
This command trims some less-time consuming nodes and edges, and labels the nodes with self-time and total time information, instead of the default precentage display.
This simple and effective approach will help you profile your Python code in AWS Lambda and start optimizing your application’s performance.
And now the real challenge begins - analyzing the profiling data and interpreting the results to identify performance bottlenecks. Goodluck!
A Step-by-Step Guide to Profiling Python Code in AWS Lambda was originally published in Level Up Coding on Medium, where people are continuing the conversation by highlighting and responding to this story.
This content originally appeared on Level Up Coding - Medium and was authored by Ella sheer
Ella sheer | Sciencx (2024-10-24T20:46:20+00:00) A Step-by-Step Guide to Profiling Python Code in AWS Lambda. Retrieved from https://www.scien.cx/2024/10/24/a-step-by-step-guide-to-profiling-python-code-in-aws-lambda/
Please log in to upload a file.
There are no updates yet.
Click the Upload button above to add an update.